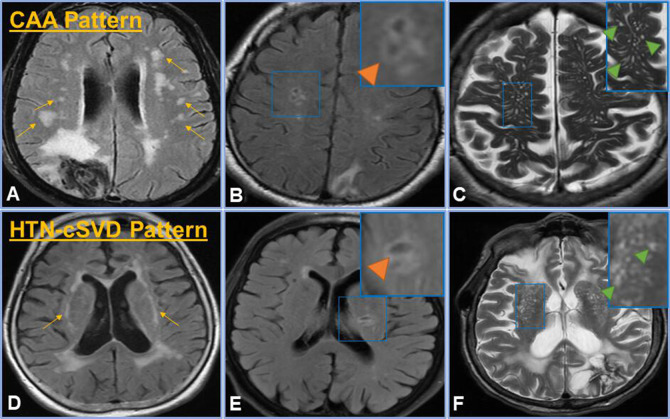
Figure 1.
cSVD groups. CAA pattern was defined by any number of CAA features ((A) multiple subcortical spots pattern on FLAIR (yellow arrows), (B) lobar lacunes on FLAIR (inset, orange arrow) and (C) severe CSO EPVS as seen on T2 (inset, green arrows)), whereas HTN-cSVD pattern includes one or more of the features in the bottom panel, which are classically attributed to HTN-cSVD ((D) peribasal ganglia WMH on FLAIR (yellow arrows), (E) deep lacunes on FLAIR (inset, orange arrow) and (F) severe basal ganglia EPVS as seen on T2 (inset, green arrows)). The mixed NHIM group included at least one imaging finding from both the CAA pattern and HTN-cSVD pattern. No NHIM had none of these imaging characteristics.CAA, cerebral amyloid angiopathy; CSO, centrum semiovale; cSVD, cerebral small vessel disease; EPVS, enlarged perivascular spaces; FLAIR, fluid-attenuated inversion recovery; HTN-cSVD, hyperintensive cerebral small vessel disease; NHIM, non-haemorrhagic imaging markers; WMH, white matter hyperintensities.

