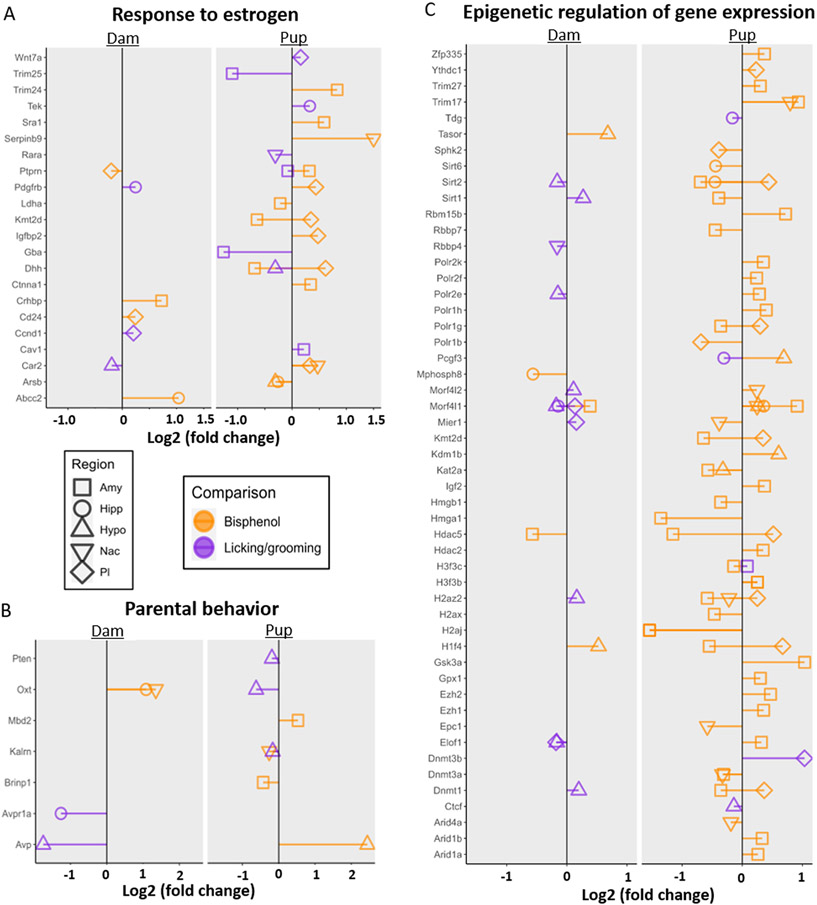
Fig. 5.
Hypothesis-driven differential gene expression. A. Log2 fold changes for genes in the “Response to Estrogen” (GO:0043627) Biological Processes gene list for dams and pups. B. Log2 fold changes for genes in the “Parental Behavior” (GO:0060746) Biological Processes gene list for dams and pups. C. Log2 fold changes for genes in the “Regulation of gene expression, epigenetic” (GO:0040029) Biological Processes gene list for dams and pups. Only data for genes with p value < .05 are shown. Fold change associated with Bisphenol exposure are shown in orange and Licking and grooming are shown in purple. Symbol shape denotes the brain region.

