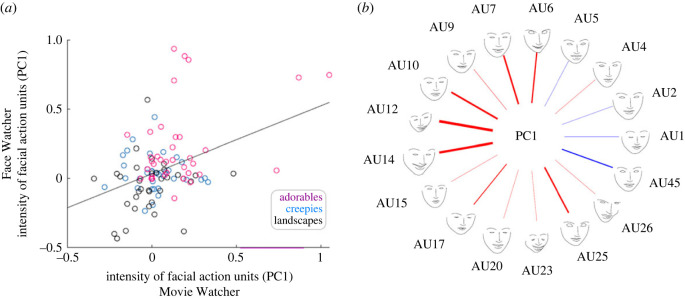
Figure 4.
(a) Scatterplot of the Movie Watcher's and Face Watcher's PC facial AUs: Movie Watcher on the x-axis and Face Watcher on the y-axis. The scatterplot illustrates the relationship between the partners' facial AUs for each of the movie types (red, 'adorables'; blue, 'creepies'; and black, 'landscapes'). All 17 AUs are included in the dataset and are represented for each movie type and all participants. Quantification of the relationship between the expresser (Movie Watcher) and the responder (Face Watcher) is based on the average of the individual correlations for each dyad (r = 0.36 ± 0.11 s.e.m). Findings are consistent with the hypothesis of facial mimicry (sometimes referred to as sensorimotor simulation, [1]). That is, the expression on the face of the Movie Watcher showed some tendency to be automatically replicated on the face of the Face Watcher. (b) Illustration of the relative contributions of each AU to PC1. The AUs are shown on the outer circle by name. The thickness of each line represents the coefficient of the AU to PC1 and the colour of the line represents the valence: positive (red) or negative (blue) of the coefficient. PC1 explains 37 ± 1.6% s.e.m. of the total variance.

