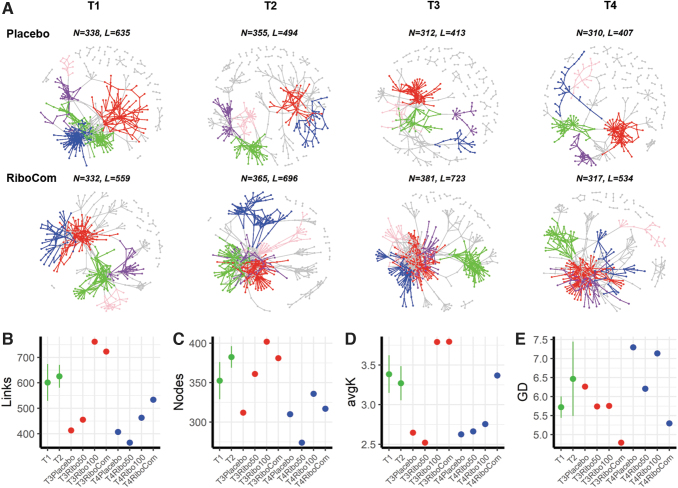
FIG. 7.
Gut bacterial networks over all time points. (A) Visualization of constructed MENs of placebo (top) and RiboCom groups (bottom) from T1 to T4. Top 5 large modules are shown in different colors, and smaller modules are shown in gray. Each network is shown based on the Pearson correlations (RMT-threshold 0.67, FDR adjusted p < 0.05) between the abundances of bacterial ASVs of 36 placebo samples and 69 RiboCom samples. N, nodes; L, links. (B–E), links (B), nodes (C), average degree (avgK) (D), and average path distance (GD) (E) are topological features of gut microbial networks. The baselines of T1 and T2 were calculated as means ± SE, and the values of T3 and T4 networks shown as dots. MEN, molecular ecological network; RMT, random matrix theory.

