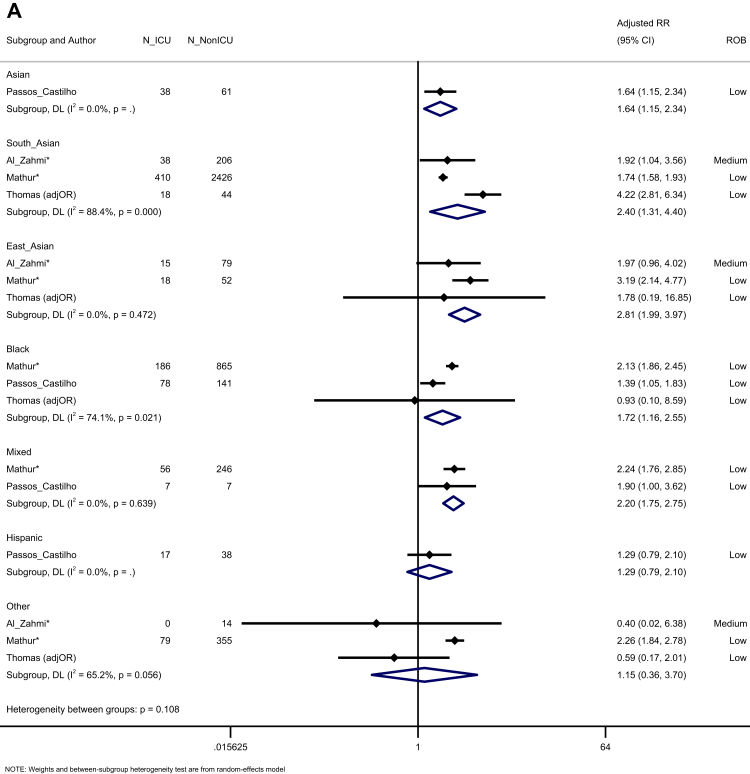
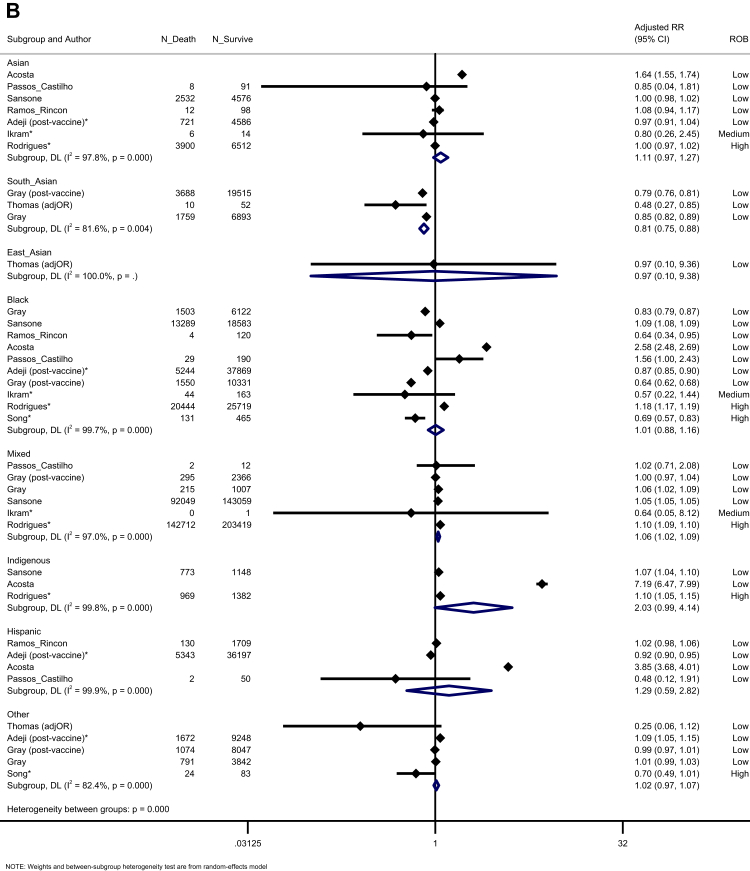
Fig. 5.
Forest plot showing the pooled effect sizes for the risk of ICU admission (compared to White majority ethnic group) in hospitalised patients with COVID-19 (A); the pooled effect sizes for the risk of mortality (compared to White majority ethnic group) in hospitalised patients with COVID-19 (B). (∗) unadjusted risk ratio used (adjOR) adjusted odds ratio used (unadjOR) unadjusted odds ratio used. R: Risk Ratio. ROB: Risk of Bias.


