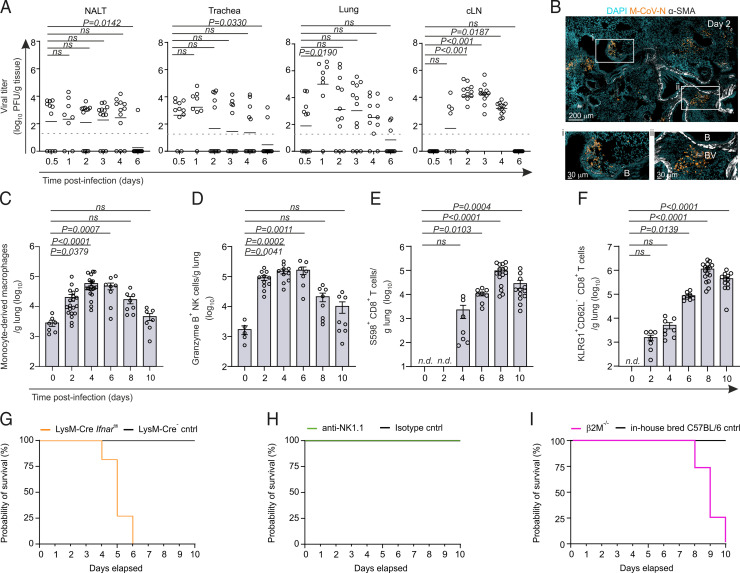
FIGURE 1.
Type I IFN–responsive macrophages control pulmonary M-CoV infection. (A) M-CoV viral titer in the nasal-associated lymphoid tissue (NALT), trachea, lungs, and cervical lymph node at the indicated time points p.i. (B) Representative immunofluorescence image of the localization of virus-infected cells as demarcated by M-CoV nucleocapsid (M-CoV N) staining in the lungs of infected mice 48 h p.i. Smooth muscle actin (SMA) demarcates the bronchioles (B) and blood vessels (BV). (C–F) Flow cytometric cell enumeration of CCR2+ Ly6C+ CD64+ monocyte-derived macrophages (C), Granzyme B+ NK cells (D), S598+CD8+ T cells (E), and KLRG1+CD62L−CD8+ T cells (F) in the lungs of M-CoV–infected mice at the indicated times. (G–I) Survival curves after M-CoV infection of LysM-Cre Ifnarfl/fl mice compared with LysM-Cre–negative controls (G), anti-NK1.1–depleted mice compared with IgG isotype-treated controls (H), and β2M−/− compared with in-house bred C57BL/6 mice (I). Data in (A) are representative of three independent experiments with n = 11 (day 0.5 p.i.), n = 8 (day 1 p.i.), and n = 12 (days 2–6 p.i.); means are indicated. Dotted lines indicate the detection limit of the assay. Data in (B) are representative of at least six mice. Data in (C)–(F) are representative of three independent experiments with n = 5–10 naive mice, n = 7–20 for day 2 p.i., n = 7–20 for day 4 p.i., n = 7–8 for day 6 p.i., n = 8–16 for day 8 p.i., and n = 7–12 for day 10 p.i. Means ± SEM are indicated. In (E) and (F), T cell counts are normalized to day 0. Data in (G)–(I) are representative of two independent experiments each, with n = 7–9 mice per group. Statistical analysis in (A) and (C)–(F) was performed using Kruskal–Wallis test with Dunn’s multiple comparisons test. n.d., not detected.

