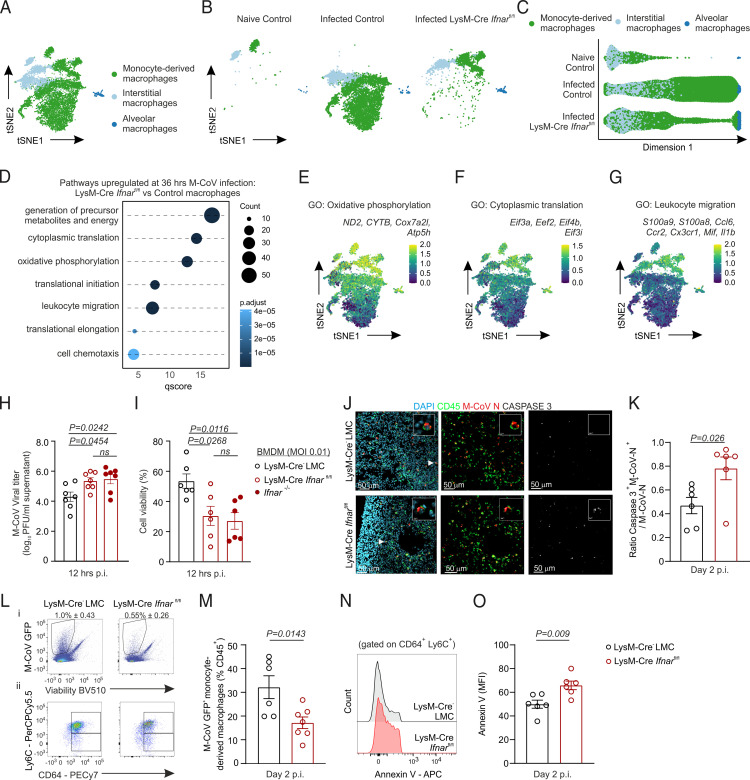
FIGURE 3.
IFNAR signaling restricts metabolic resources and cytoplasmic translation machinery to curtail viral replication and host cell death. (A and B) Dimensional reduction t-SNE plot of pulmonary macrophages from Ifnar-sufficient naive and M-CoV–infected control mice and infected LysM-Cre Ifnarfl/fl mice either merged (A) or shown per individual condition and genotype (B). (C) Diffusion map of macrophage subsets from naive and M-CoV–infected control mice and infected LysM-Cre Ifnarfl/fl mice. (D) Significantly enriched gene sets in lung macrophages of infected LysM-Cre Ifnarfl/fl compared with infected control mice. (E–G) Average expression of selected genes belonging to the indicated gene sets projected onto t-SNE plots of naive and M-CoV–infected control macrophages and LysM-Cre Ifnarfl/fl macrophages. (H and I) Quantification of M-CoV titers (H) and cell viability (I) in BMDM cultures from LysM-Cre− LMC and LysM-Cre Ifnarfl/fl and Ifnar−/− mice at 12 h after infection (multiplicity of infection 0.1). (J) Representative immunofluorescence images of apoptotic M-CoV nucleocapsid–stained, virus-infected cells as demarcated by caspase 3 staining in the lungs of LysM-Cre Ifnarfl/fl and LysM-Cre− LMC mice 48 h p.i. Arrowheads demarcate the magnified cell in the inset image. (K) Histological quantification of the ratio of caspase 3 and M-CoV nucleocapsid costained cells per total M-CoV nucleocapsid–demarcated cells in lungs of LysM-Cre Ifnarfl/fl and LysM-Cre− LMC mice 48 h p.i. (L) Representative flow cytometric plots of M-CoV GFP+ live cells (Li) and M-CoV GFP+ monocyte-derived macrophages (Lii) from lungs of LysM-Cre− LMC and LysM-Cre Ifnarfl/fl M-CoV–infected mice. (M) Quantification of the percent abundance of LysM-Cre− GFP+ monocyte-derived macrophages from CD45+ cells in the lungs of LysM-Cre Ifnarfl/fl and LysM-Cre− LMC mice. (N and O) Representative histograms (N) and quantification (O) of the mean fluorescent intensity (MFI) of Annexin V among monocyte-derived macrophages in the lungs of LysM-Cre Ifnarfl/fl and LysM-Cre− LMC mice. scRNA-seq data in (A)–(G) are representative of 10,678 macrophages. Data in (H) and (I) are representative of four independent experiments with n = 6–7 repeats for each genotype. p values as per one-way ANOVA with Tukey’s multiple comparisons test; means ± SEM are depicted. Data in (L) and (M) are representative of two independent experiments with n = 6 LysM-Cre− LMC and n = 7 LysM-Cre Ifnarfl/fl mice. Data in (J), (K), (N), and (O) are representative of two independent experiments with n = 6 LysM-Cre− LMC and n = 6 LysM-Cre Ifnarfl/fl mice. p values as per unpaired two-tailed Student t test; means ± SEM are indicated.

