FIGURE 5.
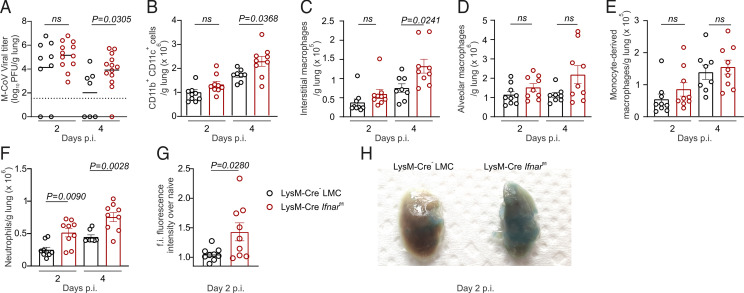
Neutrophilia-associated lung pathology and vascular permeability in Ifnar-deficient mice. (A) Viral titers in the lungs of LysM-Cre− LMC and LysM-Cre Ifnarfl/fl mice at days 2 and 4 after M-CoV infection. (B–F) Flow cytometric cell enumeration of CD11b+CD11c+ myeloid cells (B), interstitial macrophages (C), alveolar macrophages (D), monocyte-derived macrophages (E), and neutrophils (F) in the lungs of M-CoV–infected LysM-Cre Ifnarfl/fl mice compared with LysM-Cre− LMC mice at the indicated time points after infection. (G) Fold increase (f.i.) of the fluorescence intensity of serum FITC-Dextran in LysM-Cre− LMC and LysM-Cre Ifnarfl/fl mice infected 2 days earlier with M-CoV. (H) Representative images of lungs from LysM-Cre– LMC and LysM-Cre Ifnarfl/fl mice injected with Evans blue i.v. 2 days after M-CoV infection. Data in (A) are representative of three independent experiments with n = 9 LysM-Cre− LMC mice on day 2 p.i., n = 7 LysM-Cre− LMC mice on day 4 p.i., n = 12 LysM-Cre Ifnarfl/fl mice on day 2 p.i., and n = 13 LysM-Cre Ifnarfl/fl mice on day 4 p.i. Statistical analysis was performed using unpaired, two-tailed Student t test; mean is indicated. Data in (B)–(F) are representative of three independent experiments with n = 9 LysM-Cre− LMC mice and LysM-Cre Ifnarfl/fl mice on day 2 p.i., n = 8 LysM-Cre− LMC mice on day 4 p.i., and n = 9 LysM-Cre Ifnarfl/fl on day 4 p.i. p values as per one-way ANOVA with Tukey’s multiple comparisons test; means ± SEM are indicated. Data in (G) are representative of two independent experiments with n = 9 LysM-Cre− LMC and LysM-Cre Ifnarfl/fl mice each. Data in (H) are representative of two independent experiments with three mice per genotype. p values as per unpaired, two-tailed Student t test; means ± SEM are indicated.

