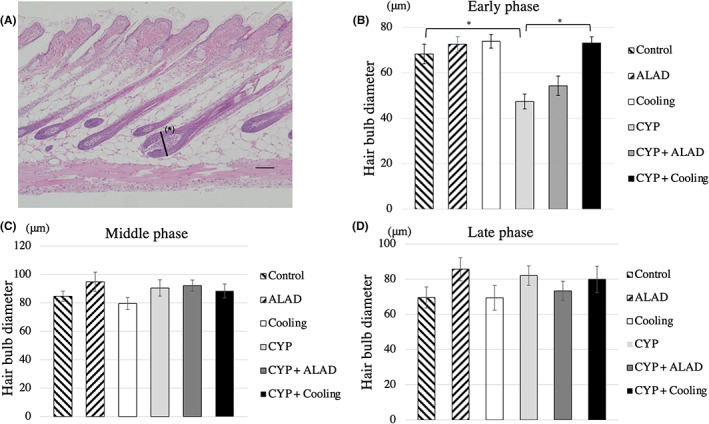
FIGURE 2.

Subcutaneous tissue measurements. A, Subcutaneous histology at the early phase in the control group. We measured the hair bulb diameter of the largest split surface (*). Scale bars, 100 μm. B–D, Comparison of the hair bulb diameter in the early phase, in the middle phase, and in the late phase. Means and standard errors of the hair bulb diameter are shown as vertical and the error bars, respectively. Statistical analysis was performed using Student's t‐test (*p < 0.05)
