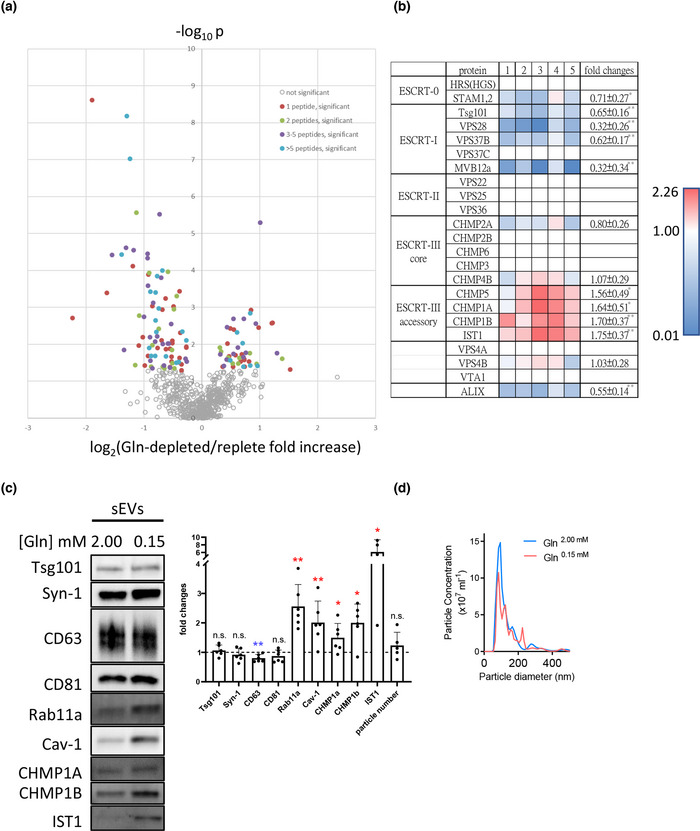
FIGURE 1.

sEV preparations from glutamine‐depleted HCT116 colorectal cancer cells contain elevated levels of accessory ESCRT‐III proteins. Five paired protein samples made from sEVs isolated by differential ultracentrifugation from glutamine‐depleted and glutamine‐replete HCT116 cells were subjected to TMT‐labelled comparative proteomics analysis. (a) Volcano plot showing mean log2 fold change in specific protein levels in sEV preparations from glutamine‐depleted conditions versus glutamine‐replete conditions plotted against ‐log10 p value for null hypothesis that levels are unchanged. Coloured data points represent proteins that are significantly altered in levels between the two conditions, with colours representing number of peptides detected. (b) Heat map showing change in levels of core and accessory ESCRT proteins in five paired sEV samples (labelled 1 to 5) from glutamine‐depleted versus glutamine‐replete HCT116 cells. Red shows an increase in protein levels and blue indicates a reduction following glutamine depletion. (c) Western blot of sEV preparations confirms that accessory ESCRT‐III proteins CHMP1A, CHMP1B and IST1 are all increased in sEVs produced by glutamine‐depleted (0.15 mM) HCT116 cells. Bar chart shows protein levels and sEV number normalised to cell lysate. Data derived from five independent experiments and analysed by the Kruskal‐Wallis test. Significantly changed levels are denoted by a blue (decreased) and red (increased) asterisks. *p < 0.05; n.s. = not significant. (d) Nanosight Tracking Analysis of sEV size and number for samples produced as in (c)
