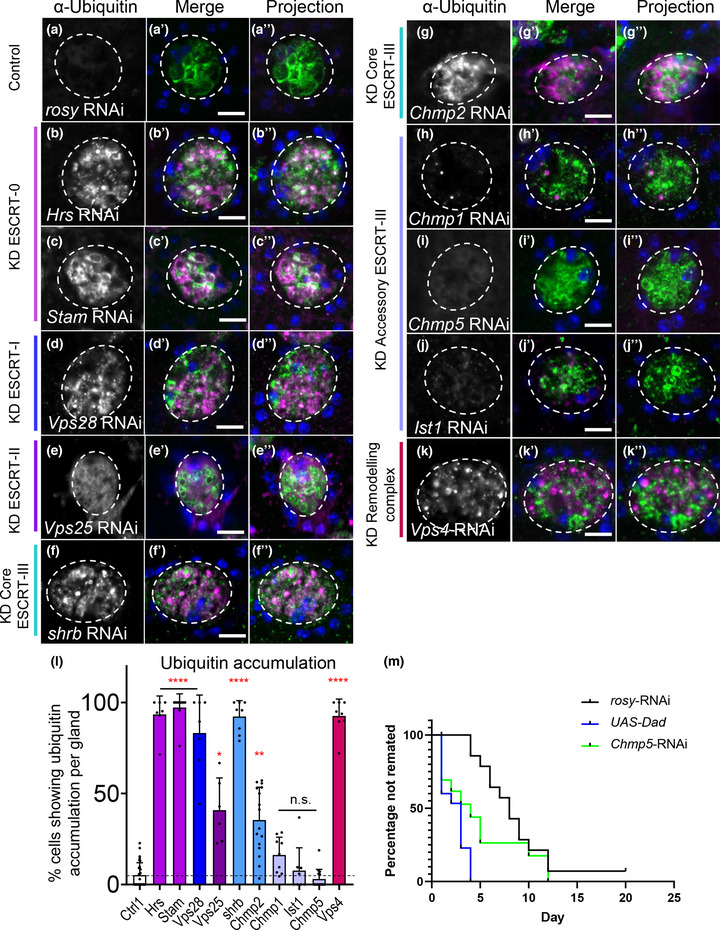
FIGURE 5.

Accessory ESCRT‐III proteins are not required for processing of ubiquitinylated ILV cargos in SCs. Panels a‐k show confocal basal images of fixed SCs isolated from males expressing Btl‐GFP and selected ESCRT‐RNAis from eclosion onwards. SC outline approximated by dashed white circles. Ubiquitin (magenta), GFP (green) and DAPI (blue; cells are binucleate) staining is shown. Nuclear staining with anti‐ubiquitin is sometimes observed, even in controls, but appears non‐specific. (a) Control SC expressing rosy‐RNAi. Essentially no cytoplasmic accumulation of ubiquitin is observed in contrast to core ESCRT knockdowns (b‐g), where ubiquitin accumulates strongly in the cytosol and some Btl‐GFP‐positive compartments (colocalization in white; L). (b) SC expressing Hrs‐RNAi. (c) SC expressing Stam‐RNAi. (d) SC expressing Vps28‐RNAi. (e) SC expressing Vps25‐RNAi. (f) SC expressing shrub‐RNAi. (g) SC expressing Chmp2‐RNAi. (h) SC expressing Chmp1‐RNAi, as for other accessory ESCRT‐III knockdowns (i‐k), does not accumulate ubiquitin in the cytoplasm (l). (i) SC expressing Chmp5‐RNAi. (j) SC expressing Ist1‐RNAi. (k) SC expressing Vps4‐RNAi. (l) Bar chart showing proportion of SCs per gland that accumulate ubiquitin in the cytoplasm in control and ESCRT knockdowns. n ≥ 6 AGs. (m) Kaplan–Meier plot of remating for females initially mated with males expressing rosy‐RNAi, Chmp5‐RNAi or BMP antagonist Dad in adult SCs under esgF/Ots control. Inhibiting BMP signalling, which suppresses secretion, or Chmp5 expression is associated with more rapid remating of females. Similar effects were observed in three independent experiments. All data are from 6‐day‐old male flies shifted to 29°C at eclosion to induce transgene expression. Note that fixation required for ubiquitin visualisation disrupts SC subcellular morphology, when compared to live imaging. Genotypes are: w; P[w+, tub‐GAL80ts]/+; dsx‐GAL4/P[w+, UAS‐btl‐GFP] with rosy‐ or RNAi #1 lines (a‐l) and w; esg‐GAL4 tub‐GAL80ts UAS‐FLP/CyO; UAS‐GFPnls actin > FRT > CD2 > FRT > GAL4/TM6 with rosy‐RNAi, chmp5‐RNAi #2 or UAS‐Dad (m). Scale bars in A‐K, 10 μm. Ubiquitinylation data were analysed by Kruskal‐Wallis test. The remating data were analysed versus rosy‐RNAi control using a Gehan‐Breslow‐Wilcoxon test. *p < 0.05, **p < 0.01, ***p < 0.001 and ****p < 0.0001 relative to control
