FIGURE 6.

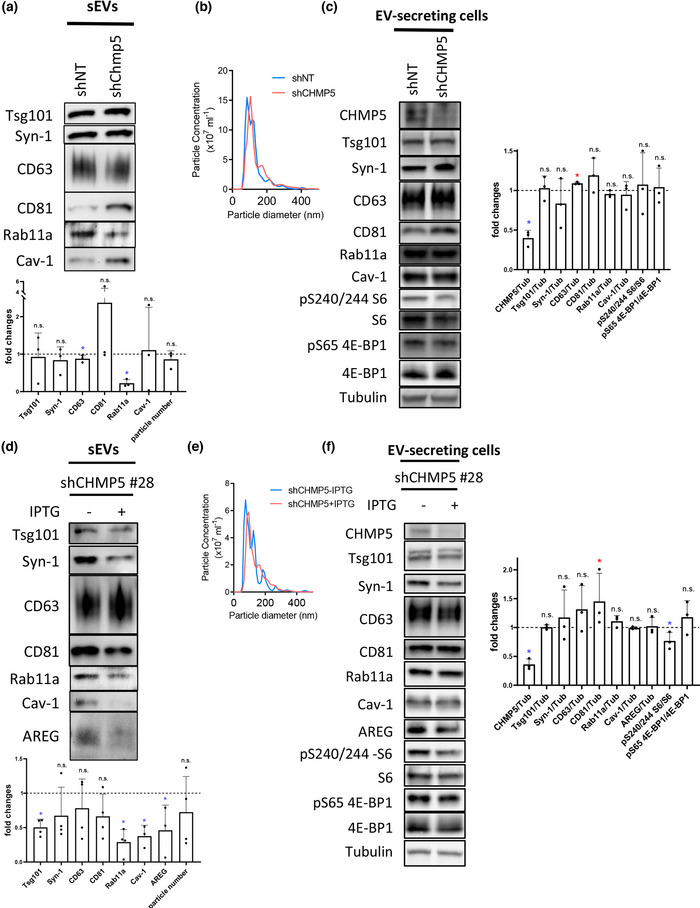
Inducible knockdown of CHMP5 selectively reduces Rab11a‐exosome production from glutamine‐depleted HCT116 cells. (a) Western blot analysis of putative exosome proteins in sEV preparations isolated by size‐exclusion chromatography (SEC) from glutamine‐depleted (0.15 mM) EV‐secreting HCT116 cells transduced with a CHMP5 (shCHMP5) compared to a non‐targeting (shNT) shRNA construct. Proteins were detected from gels with sample loading normalised to total cell lysate protein levels and the fold change in CHMP5 knockdown cells determined. Note the more variable effects of knockdown on some of the sEV markers, but not Rab11a, in the bar chart. This is presumably the result of different levels of transient CHMP5 knockdown. Data derived from three independent experiments. (B) Nanosight tracking analysis of sEVs for diluted samples (normalised to cell lysate protein levels) shows no change in particle size and number. (C) Western blot analysis of putative exosome proteins from glutamine‐depleted (0.15 mM) EV‐secreting HCT116 cells transduced with a CHMP5 (shCHMP5) compared to a non‐targeting (shNT) shRNA construct shows selective reduction in CHMP5 protein levels. The activity of mTORC1 was assessed via phosphorylation of S6 and 4E‐BP1, using phospho‐specific antibodies and a pan 4E‐BP1 antibody. Bar chart shows protein levels normalised to tubulin. Data derived from three independent experiments. (D) Western analysis of sEV preparations isolated by SEC from HCT116 colorectal cancer cells, which contain a stable IPTG‐inducible CHMP5 shRNA knockdown construct (clone #28; shCHMP5 #28), cultured in glutamine‐depleted (0.15 mM) conditions for 24 h. sEVs were collected from cells cultured in the absence (‐) or presence (+) of IPTG, both for 96 h previously and during the collection period. Putative exosome proteins were detected from gels with sample loading normalised to total cell lysate protein levels. Bar charts represent changes in levels of these putative exosome proteins relative to levels in the non‐IPTG‐induced sample. Data derived from five independent experiments. (E) Nanosight Tracking Analysis of sEVs for the shCHMP5 #28 samples produced in (D) show no change in particle size and number. (F) Western blot analysis of putative exosome proteins in EV‐secreting cells carrying a stable IPTG‐inducible CHMP5 (shCHMP5 #28) shRNA construct, under glutamine‐depleted (0.15 mM) conditions, in the presence or absence of IPTG, reveals selective reduction in CHMP5 protein levels. Bar charts derived from three independent experiments. All data for bar charts were analysed by the Kruskal‐Wallis test: *p < 0.05; n.s. = not significant. Bars and error bars denote mean ± SD
