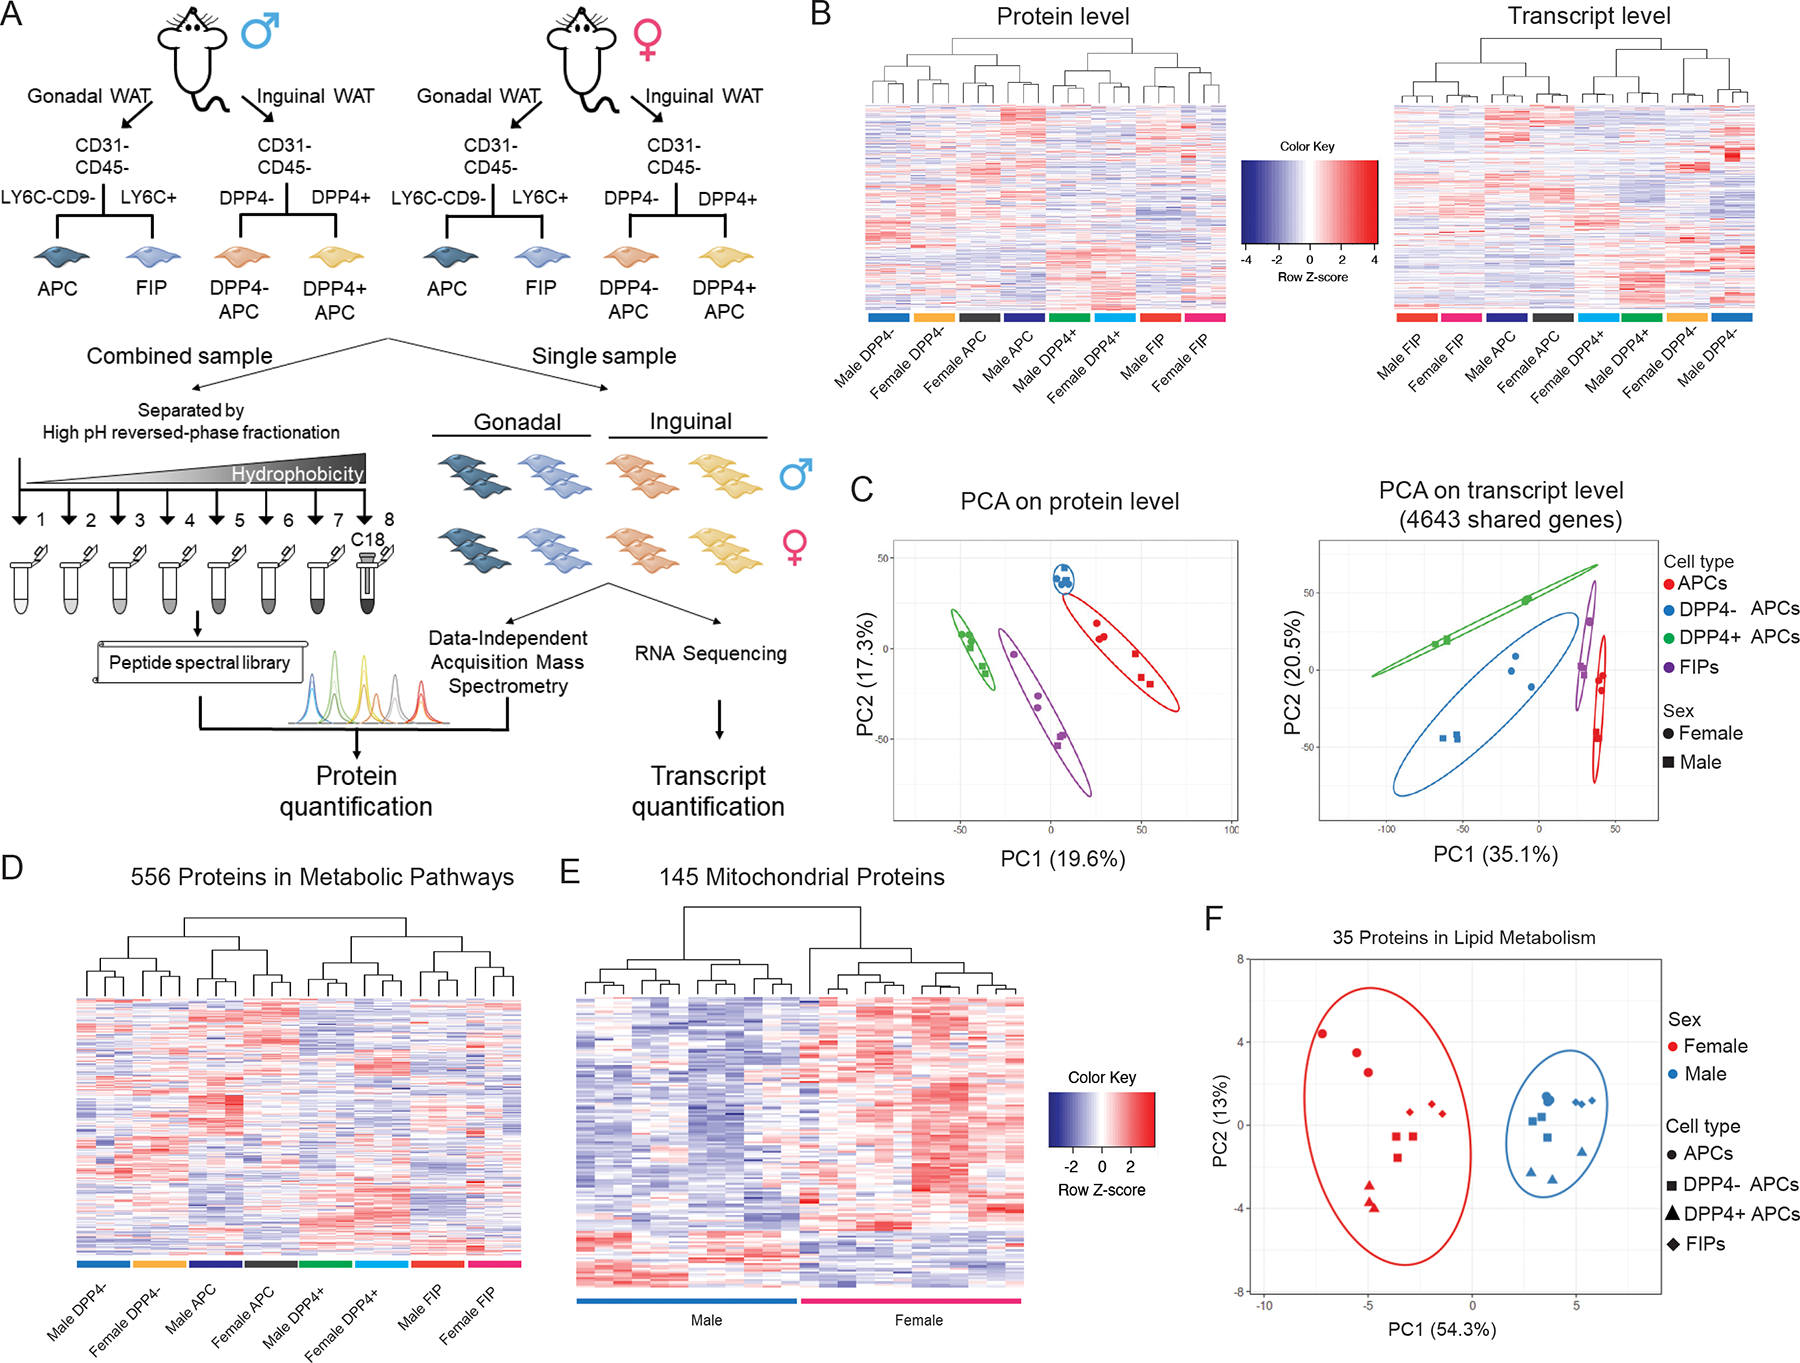
Figure 1. Multilayered omics reveal adipose tissue progenitor cell heterogeneity.

(A) Overview of the multilayered omics approach to dissect molecular signatures of adipose tissue stromal cell populations.
(B) Heat maps depicting protein levels (left) and transcript levels (right) across all 24 samples. Data were normalized to total abundance in each sample and z-score transformed. Red represents a z-score larger than 0 and blue represents a z-score smaller than 0.
(C) Principal component analysis based on proteomics (left) and transcriptomics (right) data.
(D) Sample clustering based on the expression of 556 proteins involved in metabolic pathways as annotation by GO. Data were normalized to total abundance in each sample and z-score transformed. Red represents a z-score larger than 0 and blue represents a z-score smaller than 0.
(E) Sample clustering based on the expression of 145 proteins under the GO term Cellular Component ‘mitochondrion’ that were significantly regulated by sex (ANOVA adjusted p value < 0.05).
(F) Principal component analysis of male and female populations based on expression of 35 proteins under the GO term Biological Process ‘lipid metabolic process’ that were significantly regulated by sex (ANOVA adjusted p value < 0.05).
