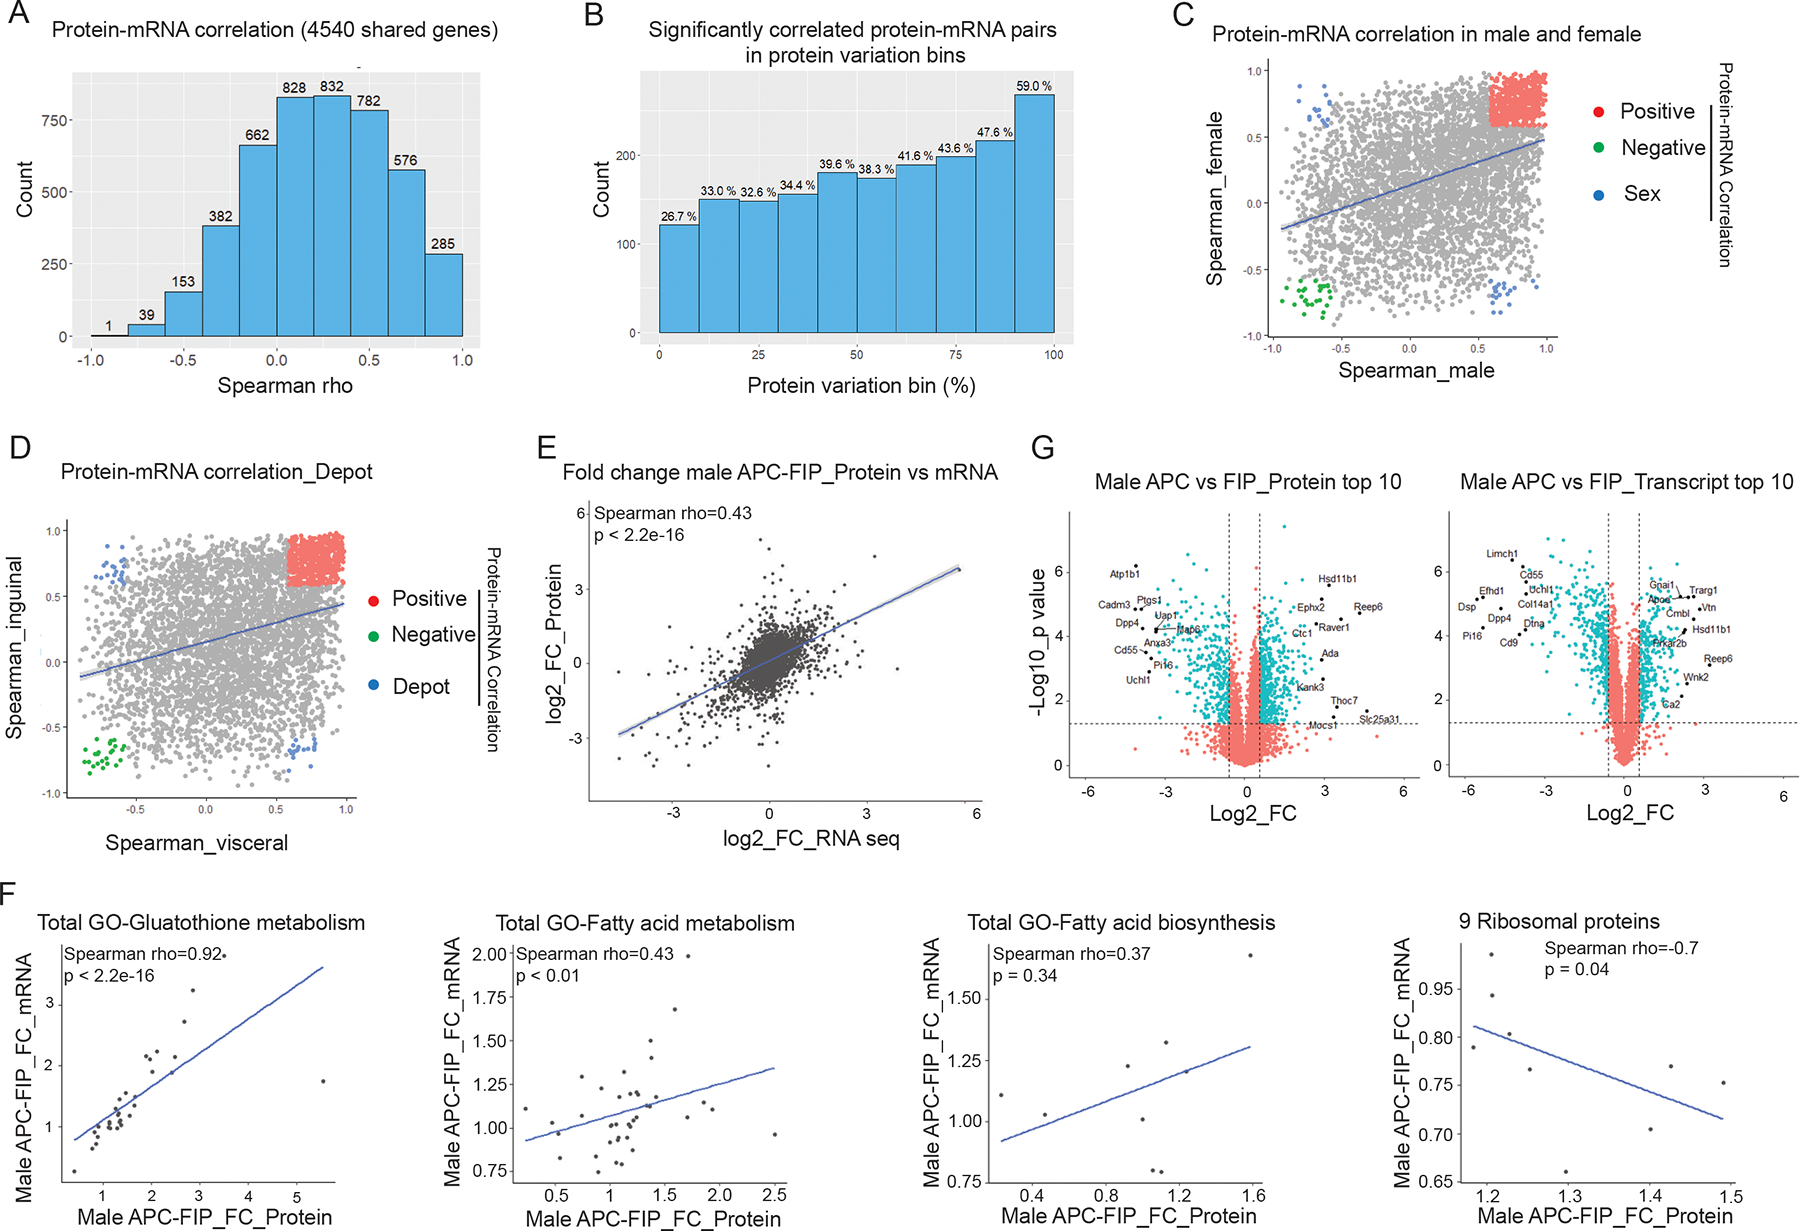
Figure 2. Protein-mRNA correlation in adipose progenitor cell populations.

(A) Histogram of Spearman’s correlation coefficients (Spearman’s rho) of the 4540 protein-mRNA pairs across all samples.
(B) Spearman’s rho prevalence of 4540 protein-mRNA pairs binned by protein variation. Y-axis shows the number of significantly correlated pairs in each bin. Numbers above the bars represent the percentages of the significantly correlated pairs out of the 454 protein-mRNA pairs in each bin.
(C) Correlation of Spearman’s rho in male vs. female populations. Colored dots represent protein-mRNA pairs with significant correlation in both male and female populations (p < 0.05). Red: positive protein-mRNA correlation. Green: negative protein-mRNA correlation. Blue: protein-mRNA correlation positive in one sex, but negative in the other.
(D) Correlation of Spearman’s rho in visceral vs. inguinal populations. Colored dots represent protein-mRNA pairs with significant correlation in both visceral and inguinal populations (p < 0.05). Red: positive protein-mRNA correlation. Green: negative protein-mRNA correlation. Blue: protein-mRNA correlation positive in one depot, but negative in the other.
(E) Correlation of fold changes (FC) between male APCs and FIPs at protein and mRNA levels.
(F) Protein-mRNA correlation in representative pathways and gene sets. Correlation plots of male APCs vs. FIPs fold changes of genes involved in the indicated pathways.
(G) Volcano plot depicting differences between male APCs and FIPs at the protein level (left) and transcript level (right). Top 10 significantly regulated (fold change) genes on each layer are labeled with gene names.
