
Figure 6. Glutathione metabolism regulates adipogenesis through controlling cellular redox balance.
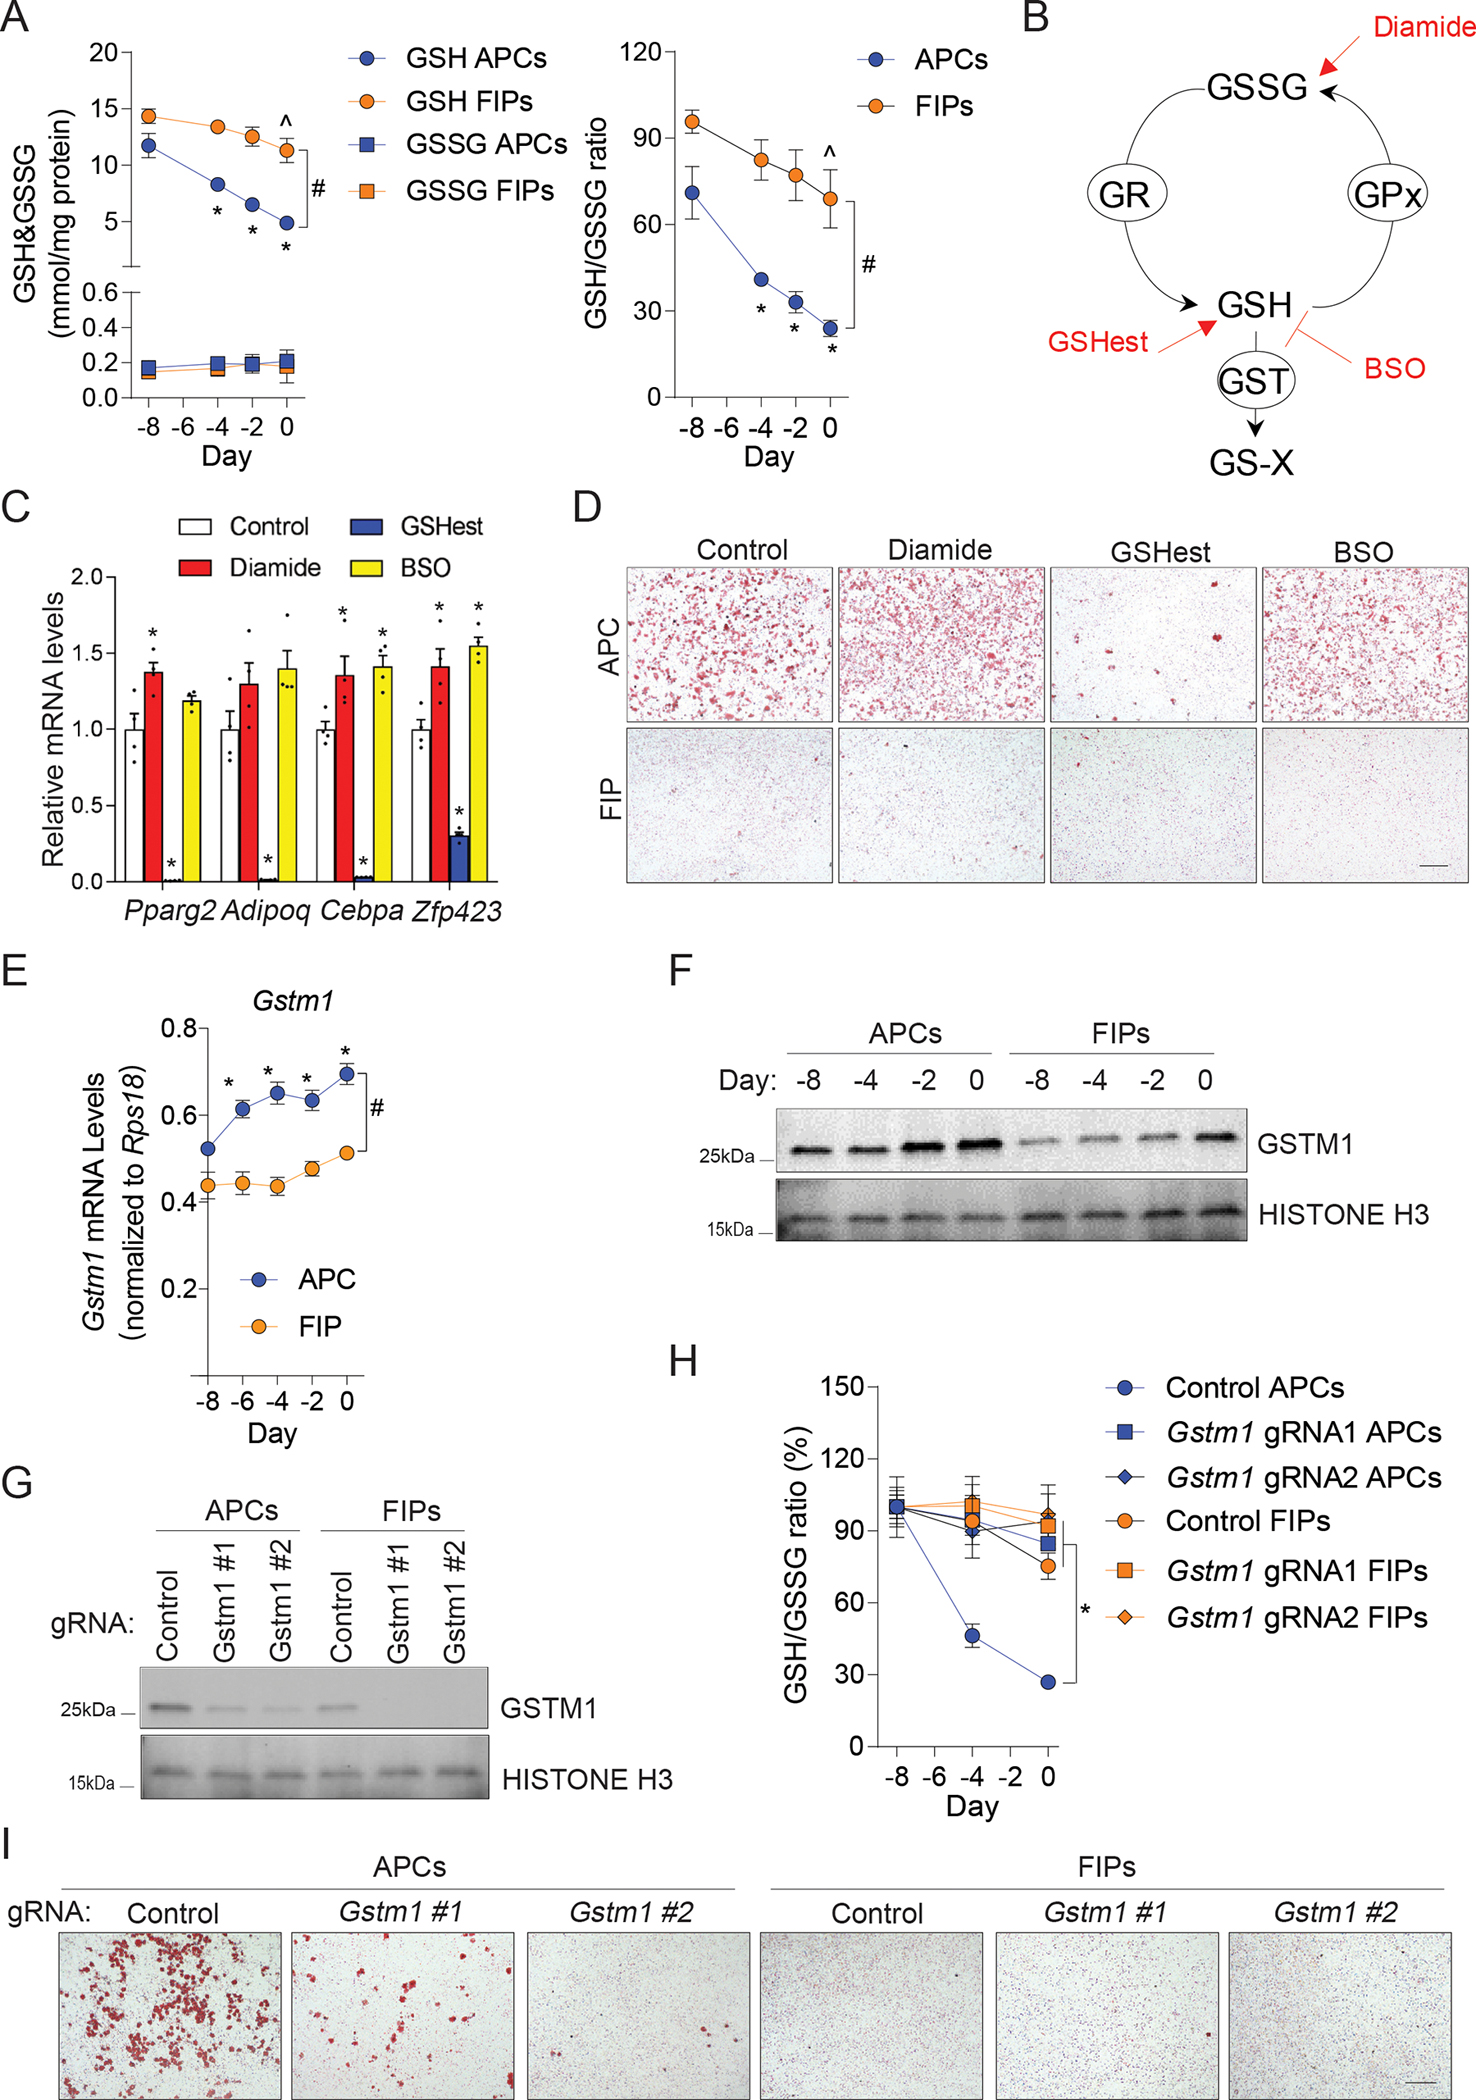
(A) Levels of glutathione (GSH) and glutathione disulfide (GSSG) (left), and GSH:GSSG ratios (right), in cell lysates from primary FIPs and APCs maintained in ITS growth media for 8 days up until the time of confluence (Day 0). N = 6. Data are shown as the mean ± s.e.m. * denotes p < 0.05 compared to APCs at Day -8, ^ denotes p < 0.05 compared to FIPs at Day -8, # denotes p < 0.05 between APCs and FIPs by two-way ANOVA.
(B) Schematic diagram of the effects of diamide, L-buthionine-sulfoximine (BSO), and GSH ethyl ester (GSHest), on the glutathione redox pathway. GST, glutatione s-transferase; GR, glutathione reductase; GPx, glutathione peroxidase; GS-X, GSH conjugates or GSH conjugated metabolites.
(C) mRNA levels of adipocyte-selective genes (Pparg2, Adipoq, Cebpa and Zfp423) in differentiated primary APCs exposed to the indicated treatments during differentiation. Differentiation was allowed to occur spontaneously while cells were maintained in ITS growth media. N = 4. Bars represent mean ± s.e.m. * denotes p < 0.05 compared to control group by one-way ANOVA.
(D) Representative bright-field images of Oil-red O-stained cultures described in (C). Scale bar = 200 μm.
(E) mRNA levels of Gstm1 in primary FIPs and APCs maintained in ITS growth media for 8 days up until the time of confluence (Day 0). N = 3. Data points represent mean ± s.e.m. * denotes p < 0.05 compared to APC day -8, # denotes p < 0.05 between APC and FIP by two-way ANOVA.
(F) Western blot analysis of GSTM1 levels in primary FIPs and APCs maintained in ITS growth media for 8 days up until the time of confluence (Day 0).
(G) Western blot analysis of GSTM1 in primary FIPs and APCs transduced with the indicated CRISPR lentivirus.
(H) GSH:GSSG ratios in cell lysates of primary FIPs and APCs transduced with the indicated CRISPR lentivirus and maintained in ITS growth media for 8 days up until the time of confluence (Day 0). N = 4. Data points represent mean ± s.e.m. * denotes p < 0.05 compared to Control APCs by two-way ANOVA.
(I) Representative bright-field images of Oil-red O-stained cultures of differentiated primary FIPs and APCs transduced with the indicated CRISPR lentivirus. Differentiation was allowed to occur spontaneously while cells were maintained in ITS growth media. Scale bar = 200 μm.