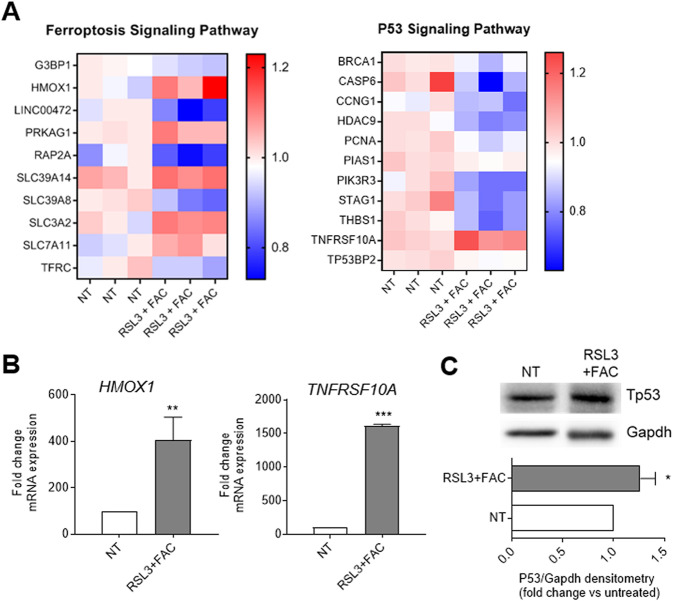
Fig. 3. RSL3+FAC treatment impact on ferroptosis and P53 molecular pathways.
A Heatmaps of modulated pathways showing the most differentially expressed genes in DU145 cells treated with 0.5 μM RSL3 + 100 μM FAC for 12 h. B, C The gene expression modulation of HMOX1 and TNFRSF10A, respectively of the ferroptosis and P53 pathway, was confirmed by RT-qPCR analyzes and expressed as % fold change over the not treated (NT) cells (B), while Western blot analysis revealed an increase of Tp53 protein. Gapdh was used for normalization (C). Data are the mean ± SEM of at least 3 experiments (*p < 0.05, **p < 0.01, ***p < 0.001).

