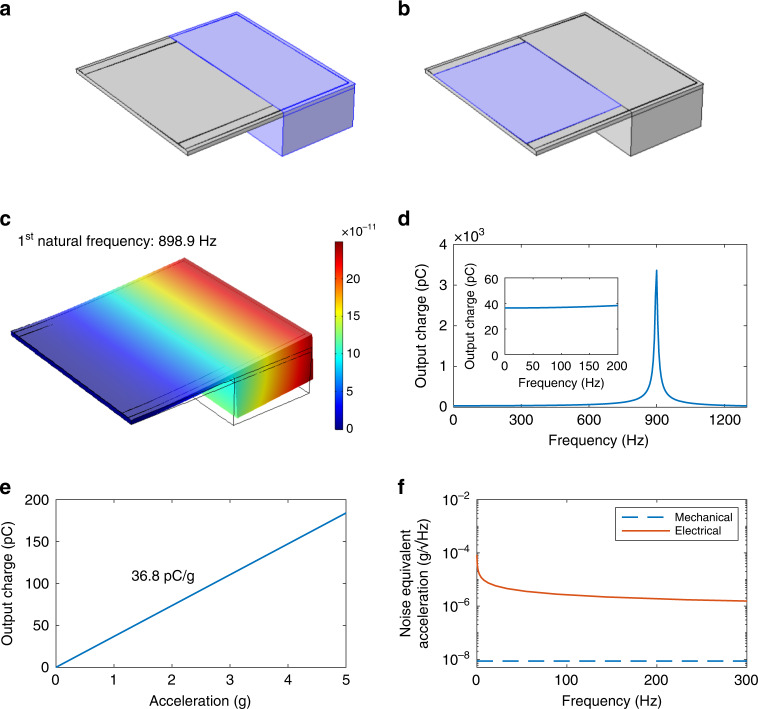
Fig. 2. Modeled structure and simulation results of the designed accelerometer.
a, b 3D structure modeled in COMSOL. Blue area in (a) is subject to inertial force. Blue area in (b) corresponds to the terminal for charge output. c The 1st vibration mode. The red indicates large displacement while the blue means smaller displacement. d Output charge versus frequency from 0.1 to 1300 Hz. Inserted is the enlarged view from 0.1 to 200 Hz. e Short-circuit output charge of the accelerometer versus excitation acceleration. f Thermal mechanical and thermal electrical noise equivalent acceleration of the accelerometer versus excitation frequency

