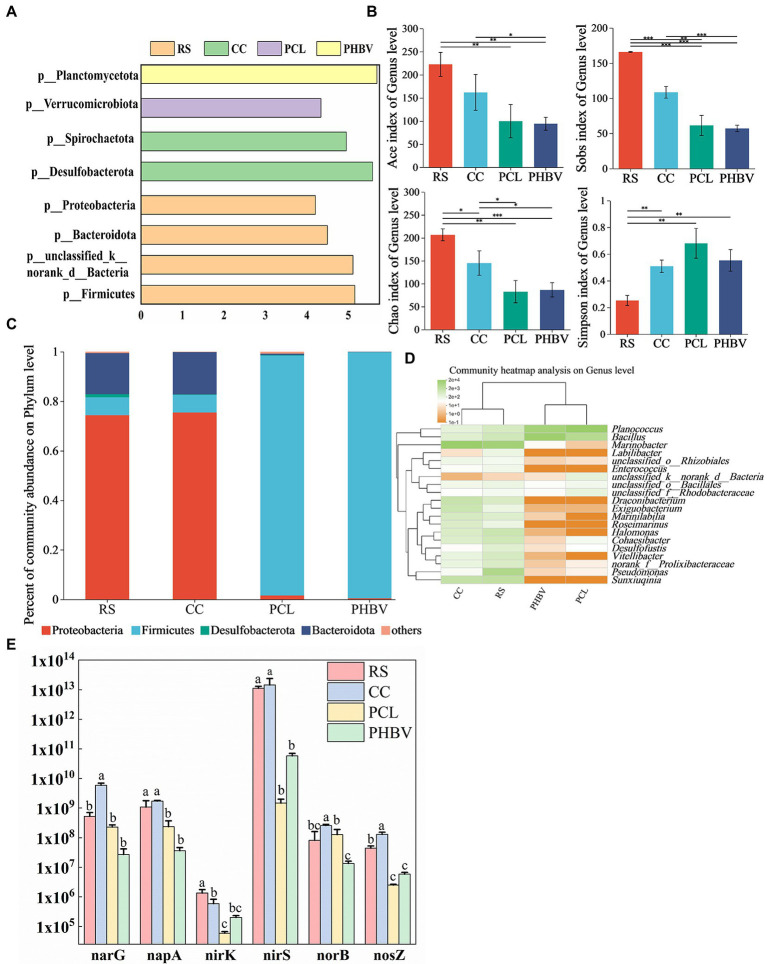
Figure 6.
Composition and structure of microbial and abundance of nitrogen-functional genes. (A) The linear discriminant analysis (LDA) analysis at phylum level; (B) Relative abundance at phylum level; (C) Alpha diversity index of microbial community at genus level; (D) Clustering heat maps at the level of the first 20 genera; (E) Differences in the abundance of the same gene with different carbon sources.

