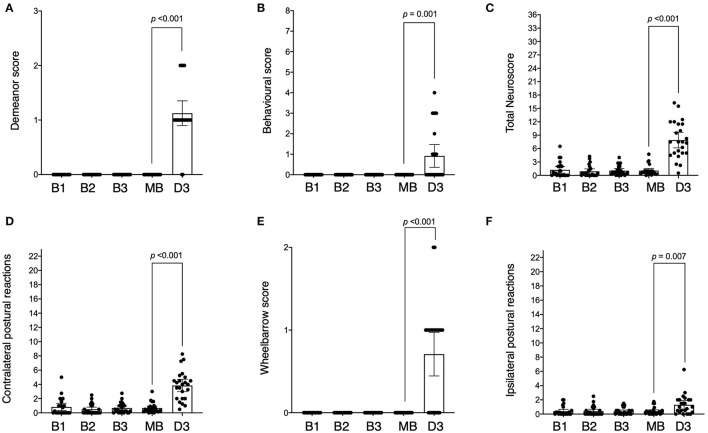
Figure 3.
Neurological scores across baseline and post-stroke testing sessions. Sessions are indicated as baseline 1 (B1), baseline 2 (B2), baseline 3 (B3), mean of all the baselines (MB), and day 3 post-stroke (D3). Scores across testing sessions are shown for demeanour [(A) score range 0–3], behaviour [(B) score range 0–8], ipsilateral postural reactions [(C) score range 0–23], contralateral postural reactions [(D) score range 0–23], wheelbarrowing [(E) score range 0–2] and total neuroscore [(F) score range 0–36]. The difference (p-value) between mean baseline and day 3 post-stroke is indicated as shown.

