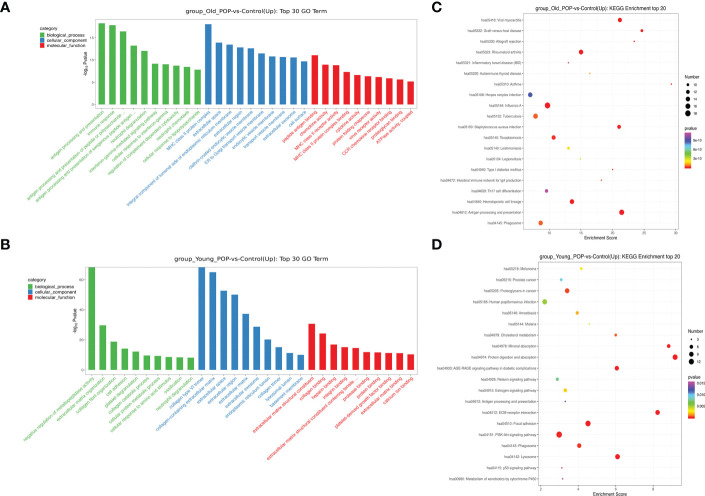
Figure 3.
GO pathway analysis and KEGG pathway analysis in Old POP, Young POP and control samples. Histogram showing up expressed biological processes in the GO analysis of Old POP vs control samples (A) or Young POP vs control samples (B) Dot plot showing up expressed biological processes in the KEGG analysis of Old POP vs control samples (C) or Young POP vs control samples (D) X-axis, gene ratio; Y-axis, enriched biological processes terms; color (red, high; blue, low), −log10(P-value) of each term; circle size, total gene counts in each term.

