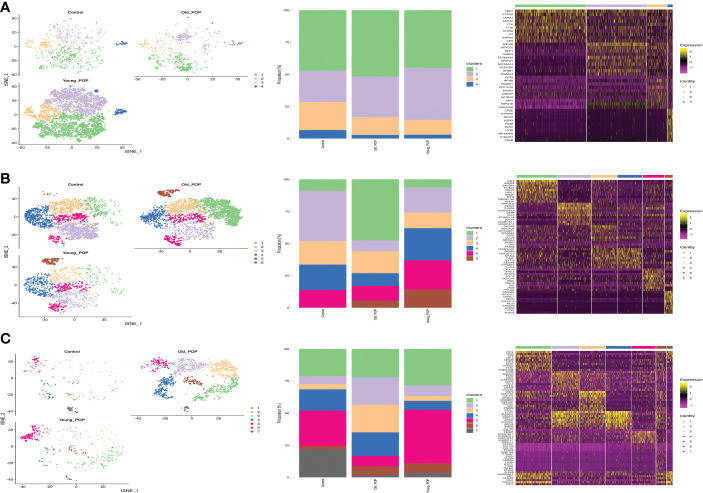
Figure 5.
Subtypes analysis in Old POP, Young POP and control samples. (A) Fibroblast; (B) Endothelial cells; (C) Macrophage. tSNE map showed the distribution of distinct cell subtypes, Bar plots showed the percentage of cell subtypes in each patient, and heat map showed the relative expression of representative differential expressed gene.

