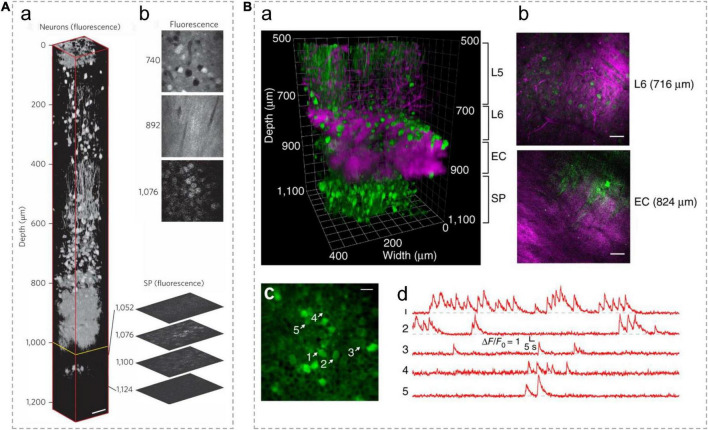
FIGURE 6.
In vivo 3P imaging in the mouse hippocampus. (A) (a) A 3D reconstruction of mouse brain images captured using 3PM, with pyramidal neurons labeled by RFP. The frames deeper than 992 μm (yellow line) were normalized to the frame at 1,076 μm and all other frames were individually normalized. Expanded optical sections showcase representative fluorescence images of the SP layer. (b) Normalized fluorescence images at various depths. Scale bar, 50 μm. Adapted with permission from Horton et al. (2013). (B) (a) A 3D reconstruction of 3PM images of neurons labeled with GCaMP6s in the mouse cortex and the hippocampus. (b) Selected frames at different depths in a show blood vessels and myelinated axons with THG signal. Scale bars, 50 μm. (c) Activity recording locates in the SP layer of the hippocampus (at 984 μm beneath the dura) with a FOV of 200 μm× 200 μm. Scale bar, 20 μm. Green indicates fluorescence signal; Magenta indicates THG signal. L5/6, layer 5/6 in cortex; EC, external capsule; SP, stratum pyramidale. (d) Spontaneous calcium signal recorded from the labeled neurons indicated in c. Adapted with permission from Ouzounov et al. (2017).

