FIGURE 7.
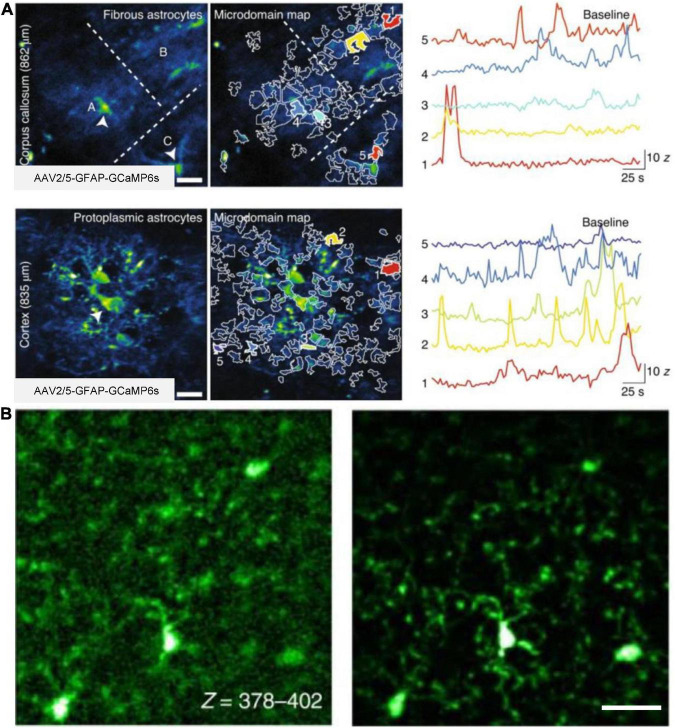
In vivo 3P imaging of astrocytes and microglia in the mouse brain. (A) Imaging of Ca2+ activity of fibrous and protoplasmic astrocytes in the white and gray matter. Top, median intensity time-series projection image of three fibrous astrocytes (A–C) in the corpus callosum (862 μm beneath dura). Arrowheads show astrocyte soma (left). Map of selected active microdomains (middle). Intensity versus time traces for five microdomains, which corresponding to colors in middle panel (right), displaying characteristics of Ca2+ transients. Bottom, similar to top, but for astrocytic Ca2+ imaging in the layer 6 of the visual cortex (835 μm beneath dura). Adapted with permission from Streich et al. (2021). (B) Maximum intensity projection images of GFP-labeled microglia in a Cx3Cr1-GFP transgenic mouse. Images captured at a depth of 378–402 μm, without AO (left) and with full AO (right) correction through the intact skull. Scale bar, 10 μm. Adapted with permission from Qin et al. (2022).

