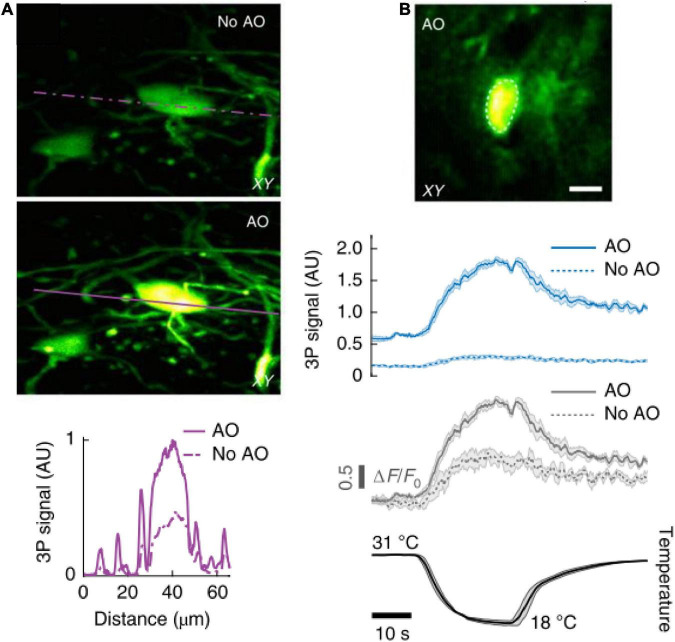
FIGURE 9.
In vivo 3P imaging in the mouse spinal cord. (A) Maximum intensity projection of spinal cord neurons (Thy1-GFP transgenic mouse) located 208–228 μm below dura, under 1,300 nm excitation, without (top) and with (bottom) AO correction. Signal intensity the purple lines. (B) AO corrected image of a jGCaMP7s-expressing neuron (310 μm below dura) of the dorsal horn in the mouse spinal cord, under 1,300 nm excitation (top). 3P fluorescence signal (middle) and calcium transients (ΔF/F0) (bottom), in response to cooling stimuli, without and with AO correction. Average traces from 4 trials; shaded area, s.e.m. Adapted with permission from Rodríguez et al. (2021).

