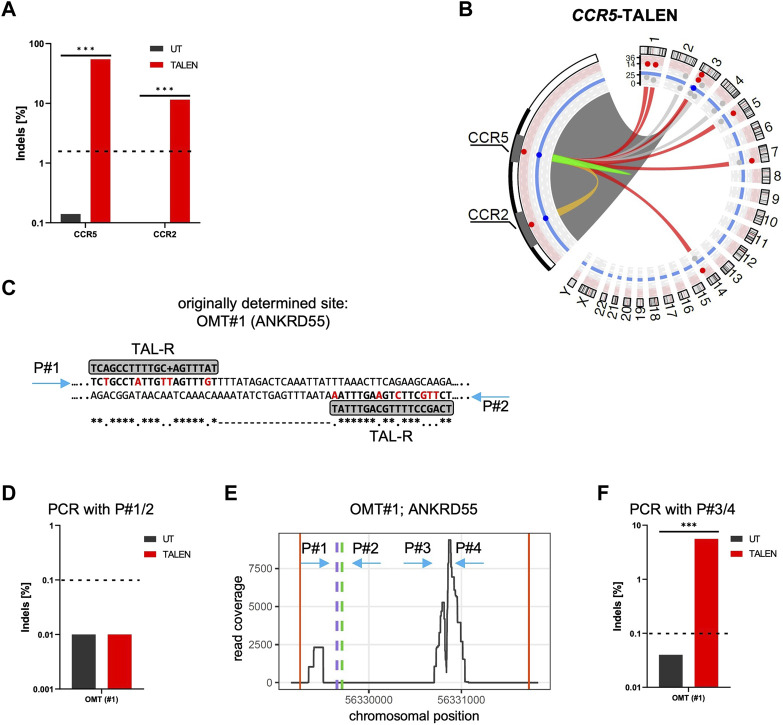
FIGURE 1.
CAST-Seq analysis for CCR5-targeting TALEN. (A) NGS-based genotyping of CCR5 and CCR2. Indicated is the fraction of alleles bearing Indels at the CCR5 on-target site and the off-target site in CCR2 in untreated (UT) T cells, and T cells edited with TALEN. (B) Structural variations. Circos plot illustrates CAST-Seq results with enlargement of the chromosome three region encompassing CCR5 and CCR2 loci. Lines represent chromosomal rearrangements with the CCR5 target site: OMTs with >20 hits in red, NBSs with >40 hits in grey, ambiguous classification (OMT/HMT) in yellow. Red and blue layers represent the alignment and homology scores, respectively. (C) Alignment. Illustrated is the CAST-Seq alignment for ANKRD55 (OMT#1) to two right TALEN arms. Mismatched bases are highlighted in red. Positions of primers P#1/P#2 for NGS validation are indicated. (D) Genotyping of ANKRD55. NGS was performed with primers P#1/P#2. (E) Coverage plot of ANKRD55. Plot shows chromosomal position vs. number of reads, the putative TALEN binding sites (green and purple dashed lines), as well as the positions of primers P#1/P#2 and P#3/P#4. Red vertical lines show boundary of region. (F) Genotyping of OMT#1. NGS was performed with primers P#3/P#4. *** specifies p-value<0.001 (Fisher’s exact test, Bonferroni corrected p-values).

