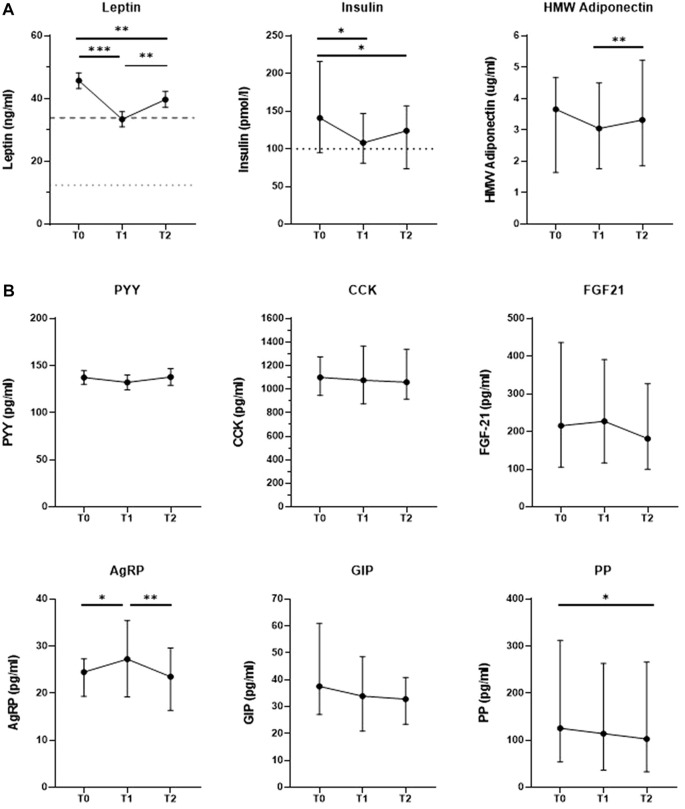
FIGURE 1.
Changes in in levels of hormones regulating appetite and energy homeostasis in response to a combined lifestyle intervention from baseline (T)) to 10 weeks (T1) and 1.5 years of treatment (T2). (A) Changes in levels of long-term adiposity-related hormones, including decreases in leptin and insulin levels towards normal levels. Cut-off lines: Upper limit of reference range for healthy populations (dotted lower line: males: 0.2–12.4 ng/ml; dashed upper line: females: 1.5–33.9 ng/ml), as used for clinical diagnostics in the Erasmus MC. Cut-off line insulin: Upper limit of reference range for healthy populations (≤ 100 pmol/l for both sexes) as used for clinical diagnostics in the Erasmus MC. N-37–39. Data are expressed as mean+/-SD SEM (leptin) or median (IQR) (insulin, HMW adiponectin), depending on normal distribution. HMW Adiponectin = High molecular weight adiponectin./. (B) No change in levels of most short-term regulators of energy balance at the end of CLI. PYY = Peptide tyrosine-tyrosine-tyrosine, CCK = Cholecystokinin, FGF21 = Fibroblast growth factor 21, AgRP = Agouti-related protein, GIP = Gastric-inhibitory polypeptide, PP = Pancreatic polypeptide. Data are expressed as mean+/-SD SEM (PYY) or median (IQR) (PP, AgRP, GIP, PYY, CCK, FGF-21), depending on normal distribution. *p < .05, **p < .01, ***p < .001 after repeated-measures ANOVA with Bonferroni-corrected post hoc test or Fridman’s test with Bonferroni-corrected post hoc tests in case of non-normality. N = 38–39.

