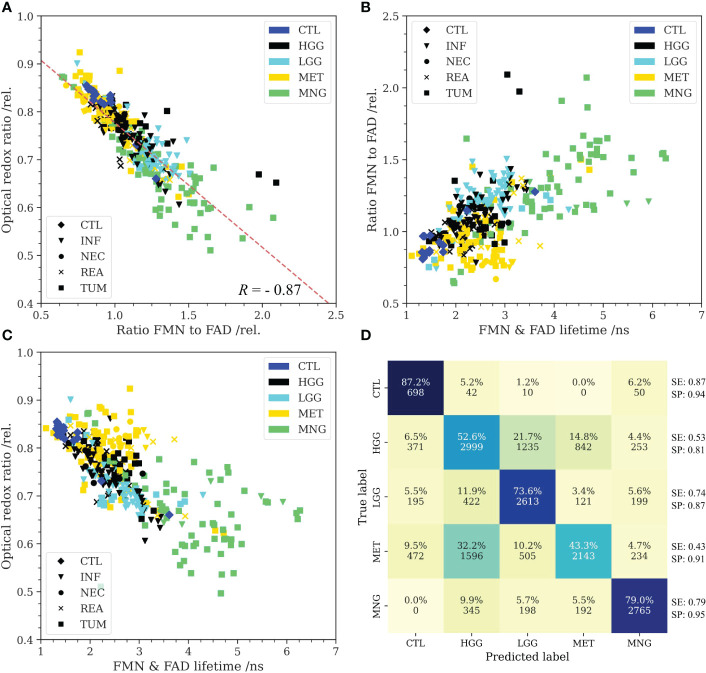
Figure 2.
(A): Higher protein-bound FMN fluorescence with respect to FAD was found to correlate with a reduced optical redox ratio (R = -0.87). All tumor entities predominantly showed reduced redox ratios and higher FMN fluorescence than non-tumorous brain (control, CTL). Only metastases (MET) were found to be heterogeneous and partly overlapped with the non-tumorous brain cluster. (B): The amount of FMN fluorescence plotted as a function of the flavin lifetime (500-580 nm) showed characteristic clusters for the different groups. While MET weren’t easily distinguishable from the CTL group in the redox ratio, flavin lifetime was predominantly increased beyond the lifetimes in non-tumorous brain. (C): Redox ratio plotted as a function of the flavin lifetime implied that the predominant metabolic strategy was characteristic for the different tumor entities. Note the high flavin lifetimes of MNG. Markers further indicate the predominant histopathological tissue classification for (A-C) (INF: tumor infiltrated brain, NEC: necrosis, REA: reactive tissue, TUM: core tumor). (D): Confusion matrix for classification of the different groups with a support vector machine. Input to the model were the optical redox ratio, the FMN/FAD ratio and the flavin lifetime. Autofluorescence was highly characteristic for CTL and meningiomas (MNG). MET were partly misclassified as high-grade gliomas (HGG) implying similarities with respect to the predominant metabolic strategy. Further, classification uncertainty existed between low-grade gliomas (LGG) and HGG. Multi-class sensitivity (SE) and specificity (SP) are given at the end of each row.

