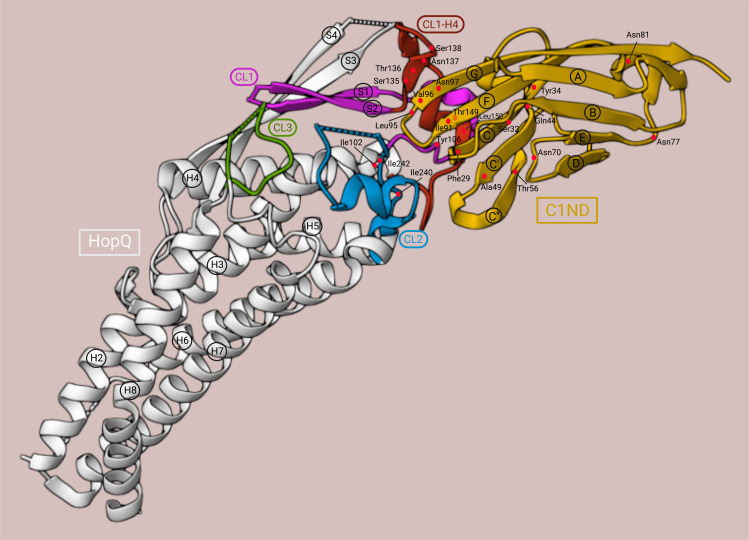
Figure 4.
3D structure of the HopQAD-I-C1ND interaction. C1ND, yellow; HopQAD-I, white; CL1, magenta; CL1-H4, red; CL2, blue; CL3, green. The residues are depicted as red dots. This illustration was adapted from the crystal structure representation generated by Moonens et al. (78) using RCSB Protein Data Bank (79) (PDB ID: 6GBG, www.rcsb.org) and Mol* (80) (www.molstar.org).

