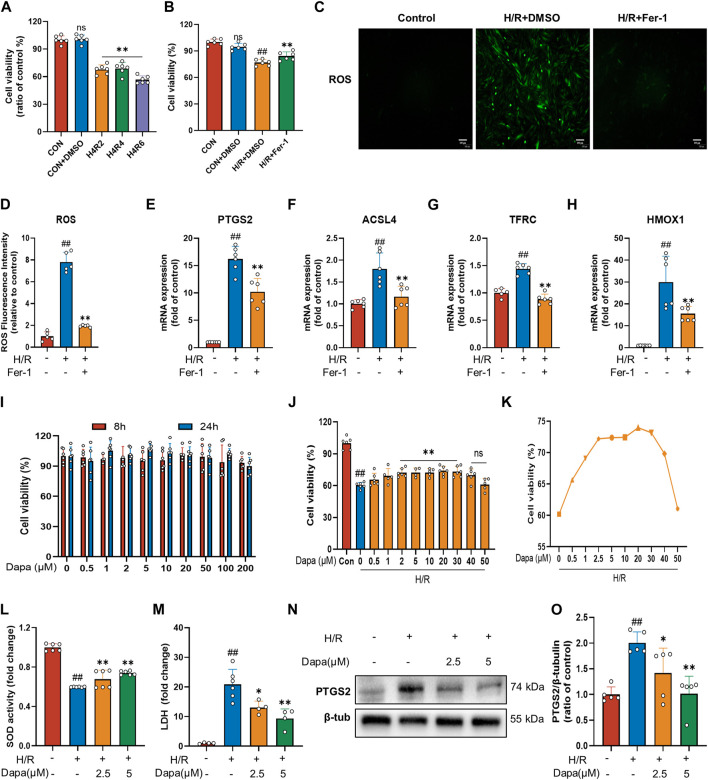
FIGURE 1.
Dapagliflozin protects H9C2 cells against H/R-triggered cell injury. (A) Viability of H9C2 cells treated with hypoxia for 4 h and reoxygenation for 2, 4, 6 h. Cell viability was detected by CCK-8 assay (n = 6 per group). (B) Ferrostatin-1 (Fer-1; 2 μM) attenuates H/R-induced cell death. Cell viability was detected by CCK-8 assay (n = 6 per group) (C) Representative fluorescent images of ROS staining by using DCFH-DA (scale bar, 100 μm), (D) and quantification of ROS fluorescence intensity (n = 5 per group). (E–H) RT‒qPCR results of PTGS2, ACSL4, TFRC and HMOX1 in H9C2 cells pretreated with Fer-1 and subjected to H/R (n = 6 per group). (I) Effects of DAPA administration for eight or 24 h on the survival of H9C2 cells detected by CCK-8 assay (n = 6 per group). (J) Effects of DAPA treatment on H/R-induced cell death detected by CCK-8 (n = 6 per group). (K) H/R-induced cell viability (%) of DAPA at different concentrations, cell viability was detected by CCK-8 assay (n = 6 per group). (L) Measurement of SOD activity by a commercial kit (n = 6 per group). (M) Total cellular LDH release was measured by a commercial kit (n = 4–6 per group). (N–O) Western blot analysis of PTGS2 in H9C2 cells after treatment with DAPA (2.5 or 5 μM) (n = 5 per group). Data are expressed as mean ± SD; Statistical analysis: One-way ANOVA followed by Tukey’s correction for post hoc multiple comparisons or Dunnett’s multiple comparison tests; #p < 0.05, ##p < 0.01 vs Control group; *p < 0.05, **p < 0.01 vs H/R group.

