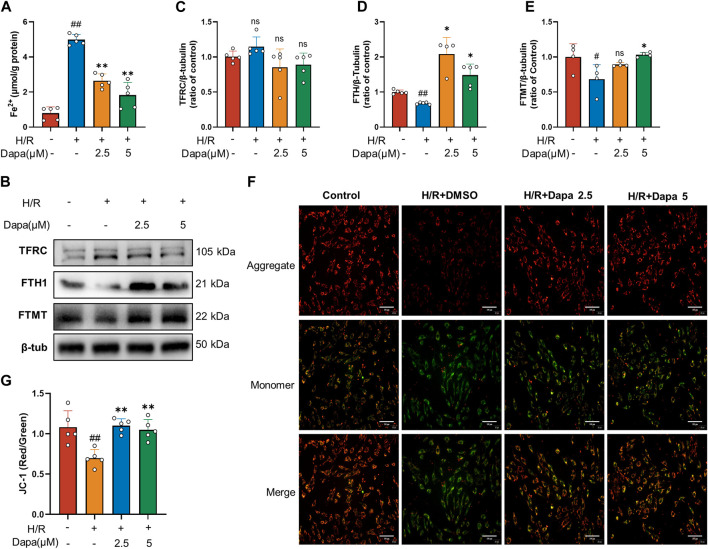
FIGURE 4.
Dapagliflozin regulates intracellular iron metabolism and mitochondrial function. (A) Intracellular Fe2+ accumulation was assayed by a commercial kit (n = 5 per group). (B–E) The protein levels of TFRC, FTH1 and FTMT were measured by western blotting and quantitative analyses (n = 4, 5 per group). (F, G) Representative fluorescence images of JC-1 staining and quantitative analyses according to the red optical density/green optical density (scale bar, 100 μm, n = 5 per group). Data are expressed as mean ± SD; One-way ANOVA followed by Tukey’s correction for post hoc multiple comparisons or Dunnett’s multiple comparison tests; #p < 0.05, ##p < 0.01 vs Control group; *p < 0.05, **p < 0.01 vs H/R group.

