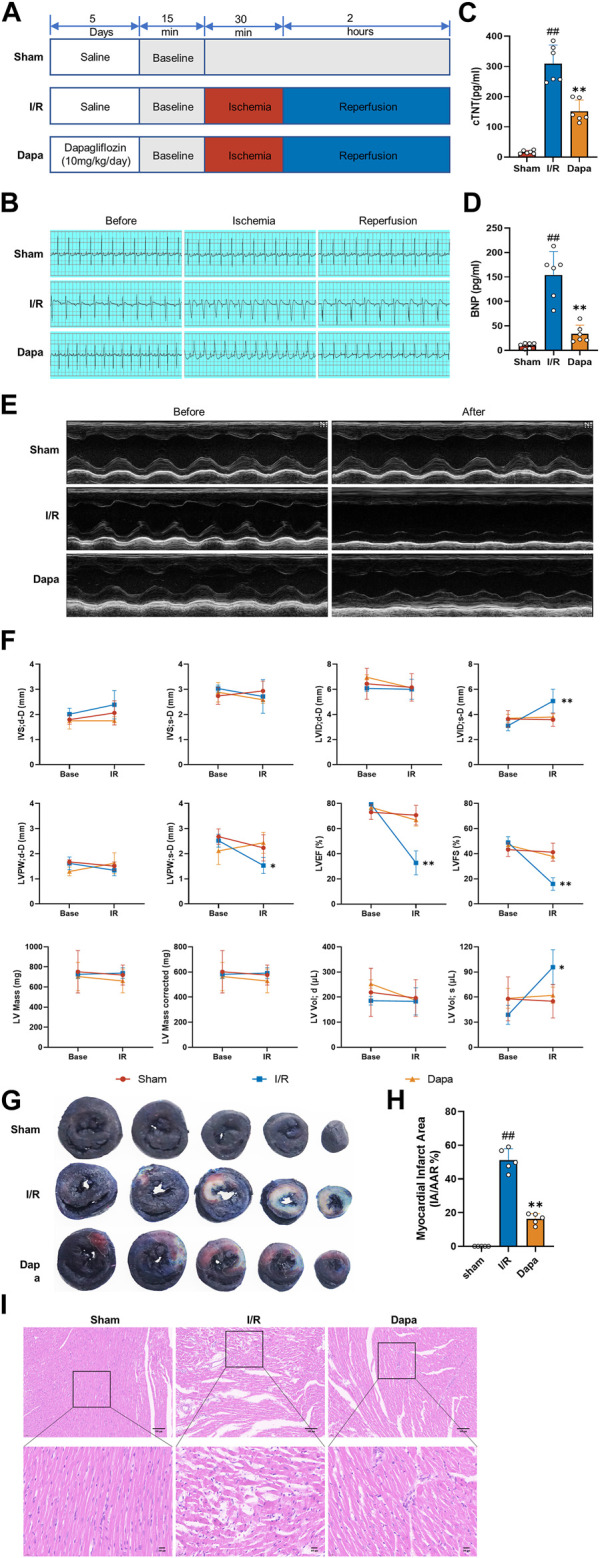
FIGURE 5.

The protective effect of dapagliflozin on myocardial I/R injury in vivo. (A) Experimental protocols. (B) Typical ECG segments in the basic state after 30 min of ligation and reperfusion for 2 h (C, D) cTnT and BNP concentrations in each group were detected by ELISA kit (n = 6 per group). (E) Representative transthoracic echocardiography images of the basal state and after reperfusion. (F) Cardiac echocardiography parameters of the experimental rats, including IVS, LVID, LVPW, LVEF (%), LVFS(%), LV mass and volume (n = 5 per group). (G) Representative cross-section images of Evans Blue/TTC double-stained ventricle hearts subjected to I/R in the absence or the presence of Dapa. The red regions represent the area at-risk (TTC stained), the blue regions represent the non-affected areas (Evans Blue stained), and the white regions represent the infarct areas (n = 5 per group). (H) Quantitative analysis of hearts showed a significant reduction in the percentage of white/white + red areas (IA/AAR) of the hearts. (I) Representative images of the left ventricle stained with hematoxylin and eosin (scale bar, 100 μm). Data are expressed as mean ± SD; One-way ANOVA followed by Turkey post hoc tests for TnT, BNP and infarct area analysis, 2-way ANOVA for repeated measures followed by Sidak’s multiple comparison tests for echocardiography parameters analysis; #p < 0.05, ##p < 0.01 vs Sham group; *p < 0.05, **p < 0.01 vs I/R group.
