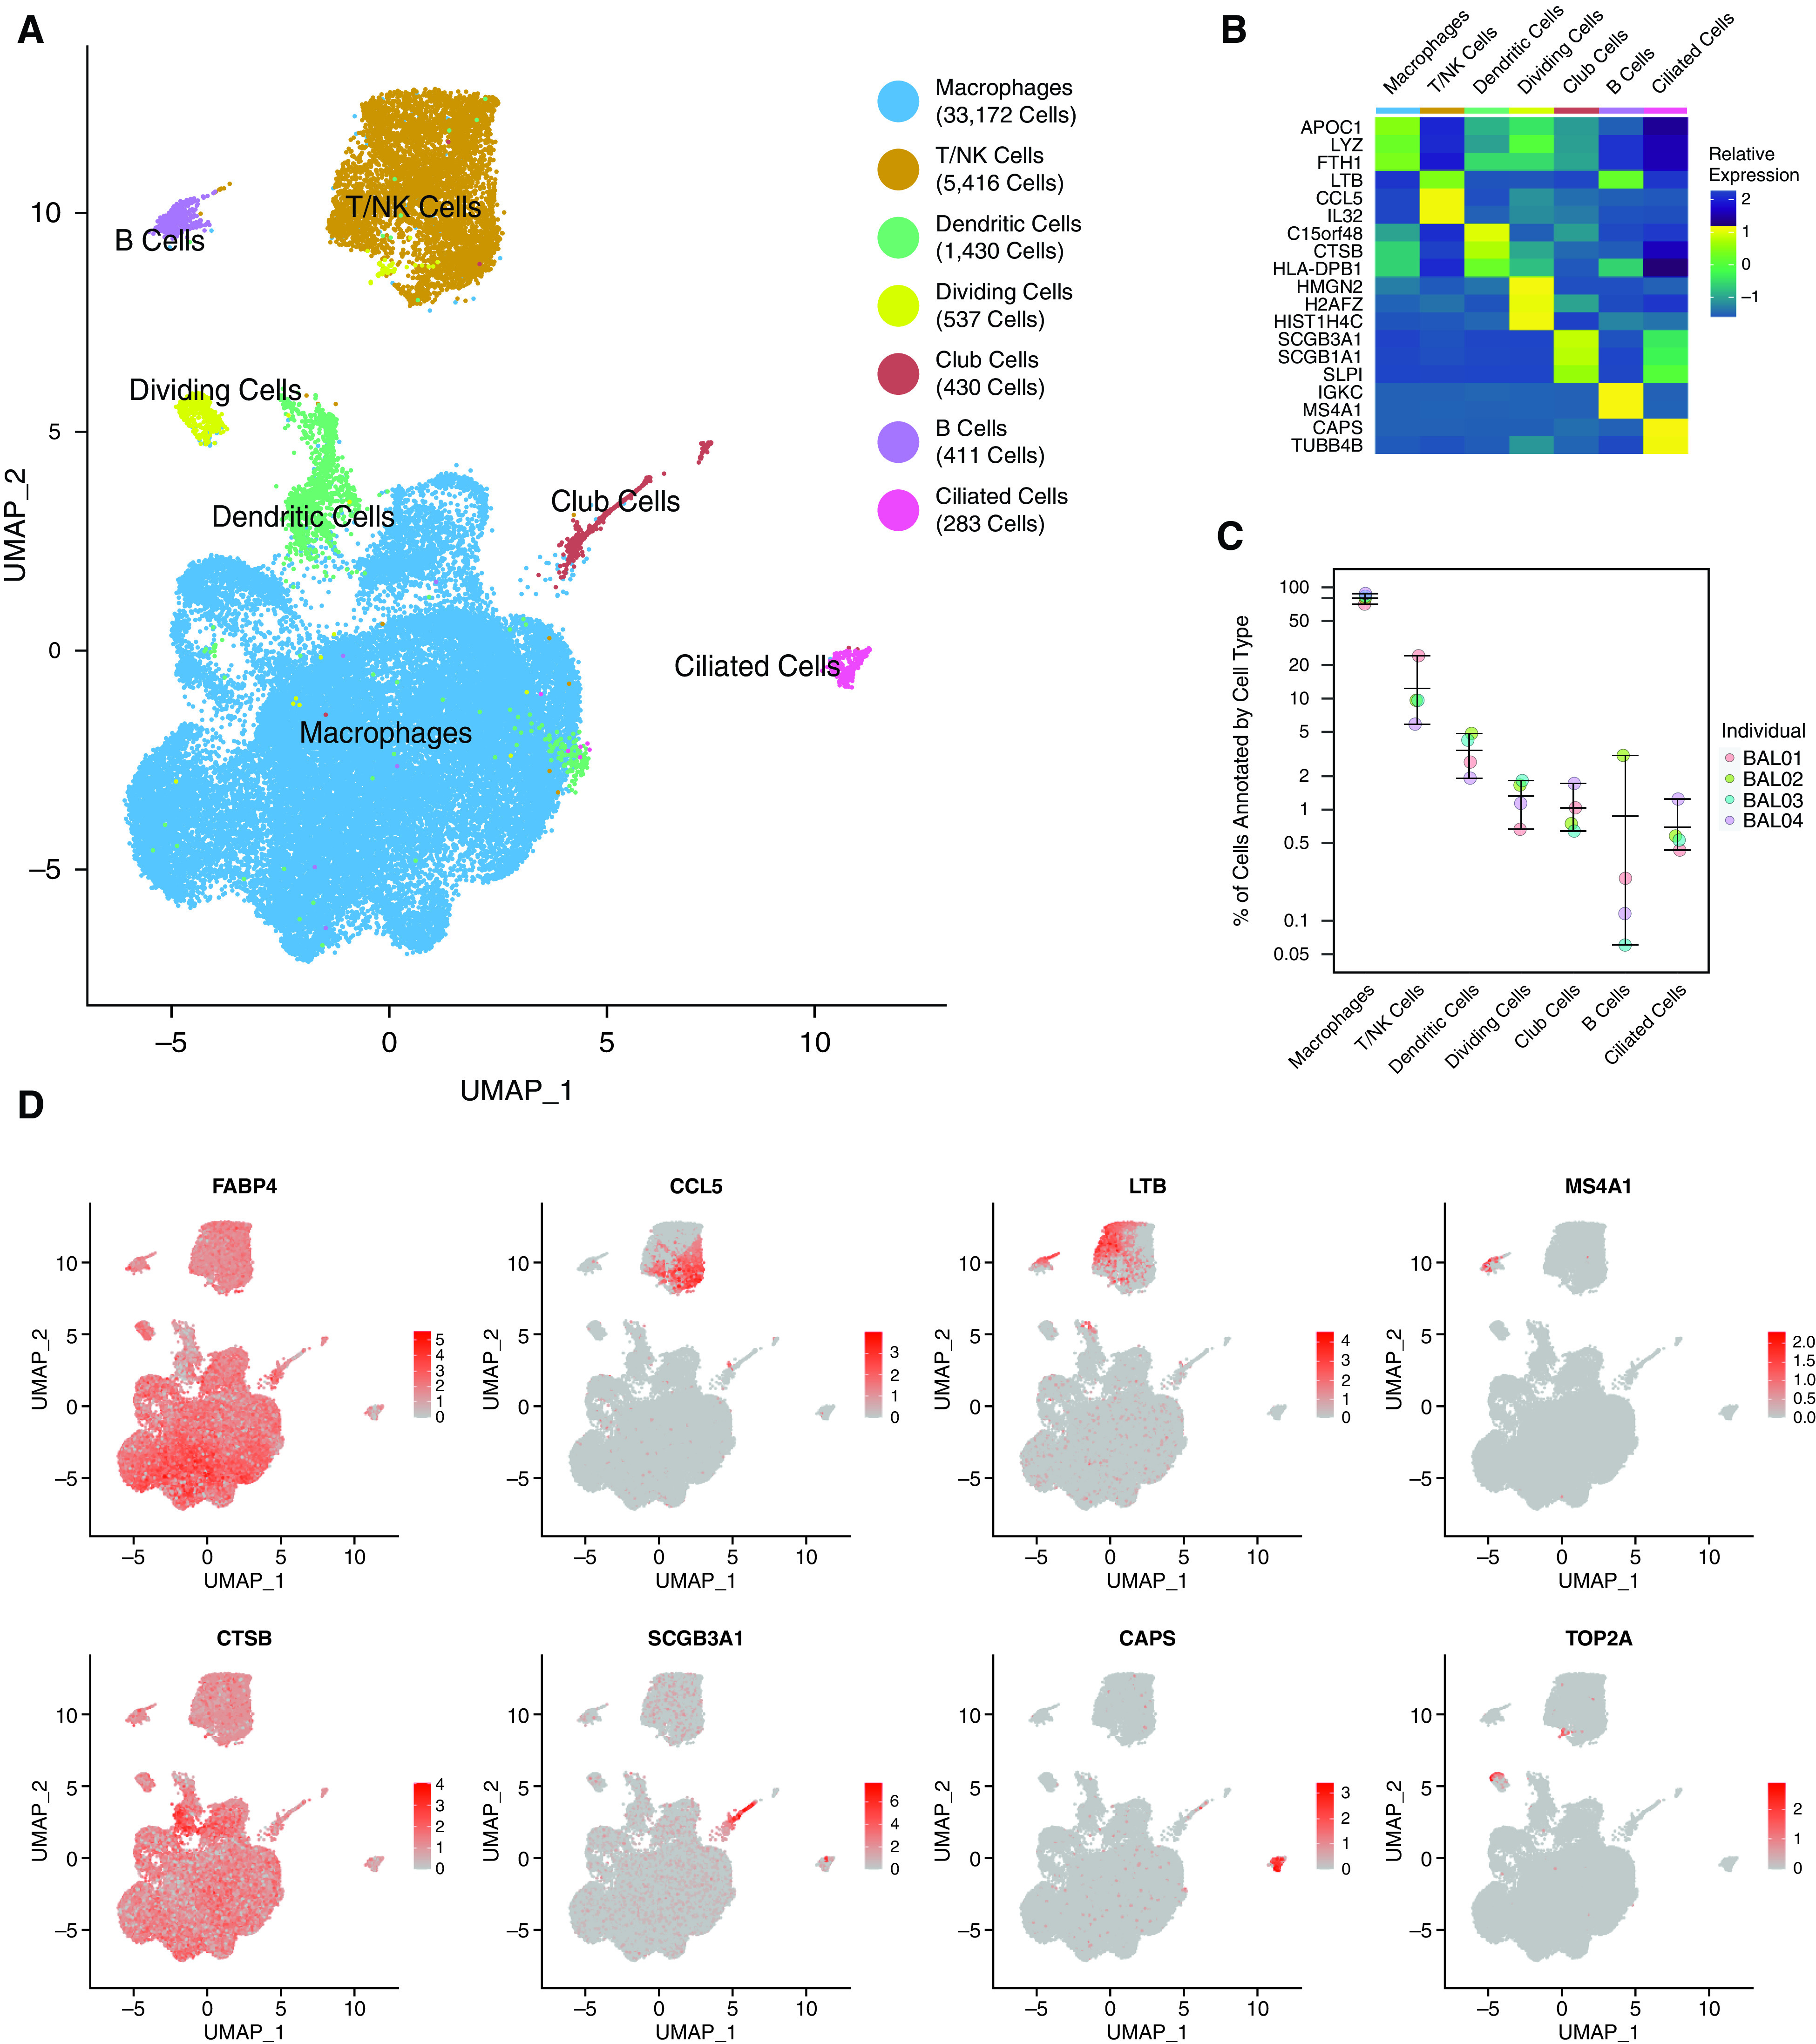
Figure 1.

Single-cell RNA sequencing identifies diverse cell populations in BAL fluid from healthy control volunteers. (A) UMAP representation of the transcriptional profile of BAL cells manually annotated as one of six cell types or dividing cells. The total number of cells in each cell type is indicated in the legend. (B) Relative expression of the top two to three marker genes (by fold change) across cell types. (C) Percentage (in log scale) of cells in each cell type by individual sample. Whiskers represent the range of values. (D) Visualization of normalized expression for canonical cell type genes across cells. All figures represent data from BAL01-04. NK = natural killer; UMAP = uniform manifold approximation and projection.
