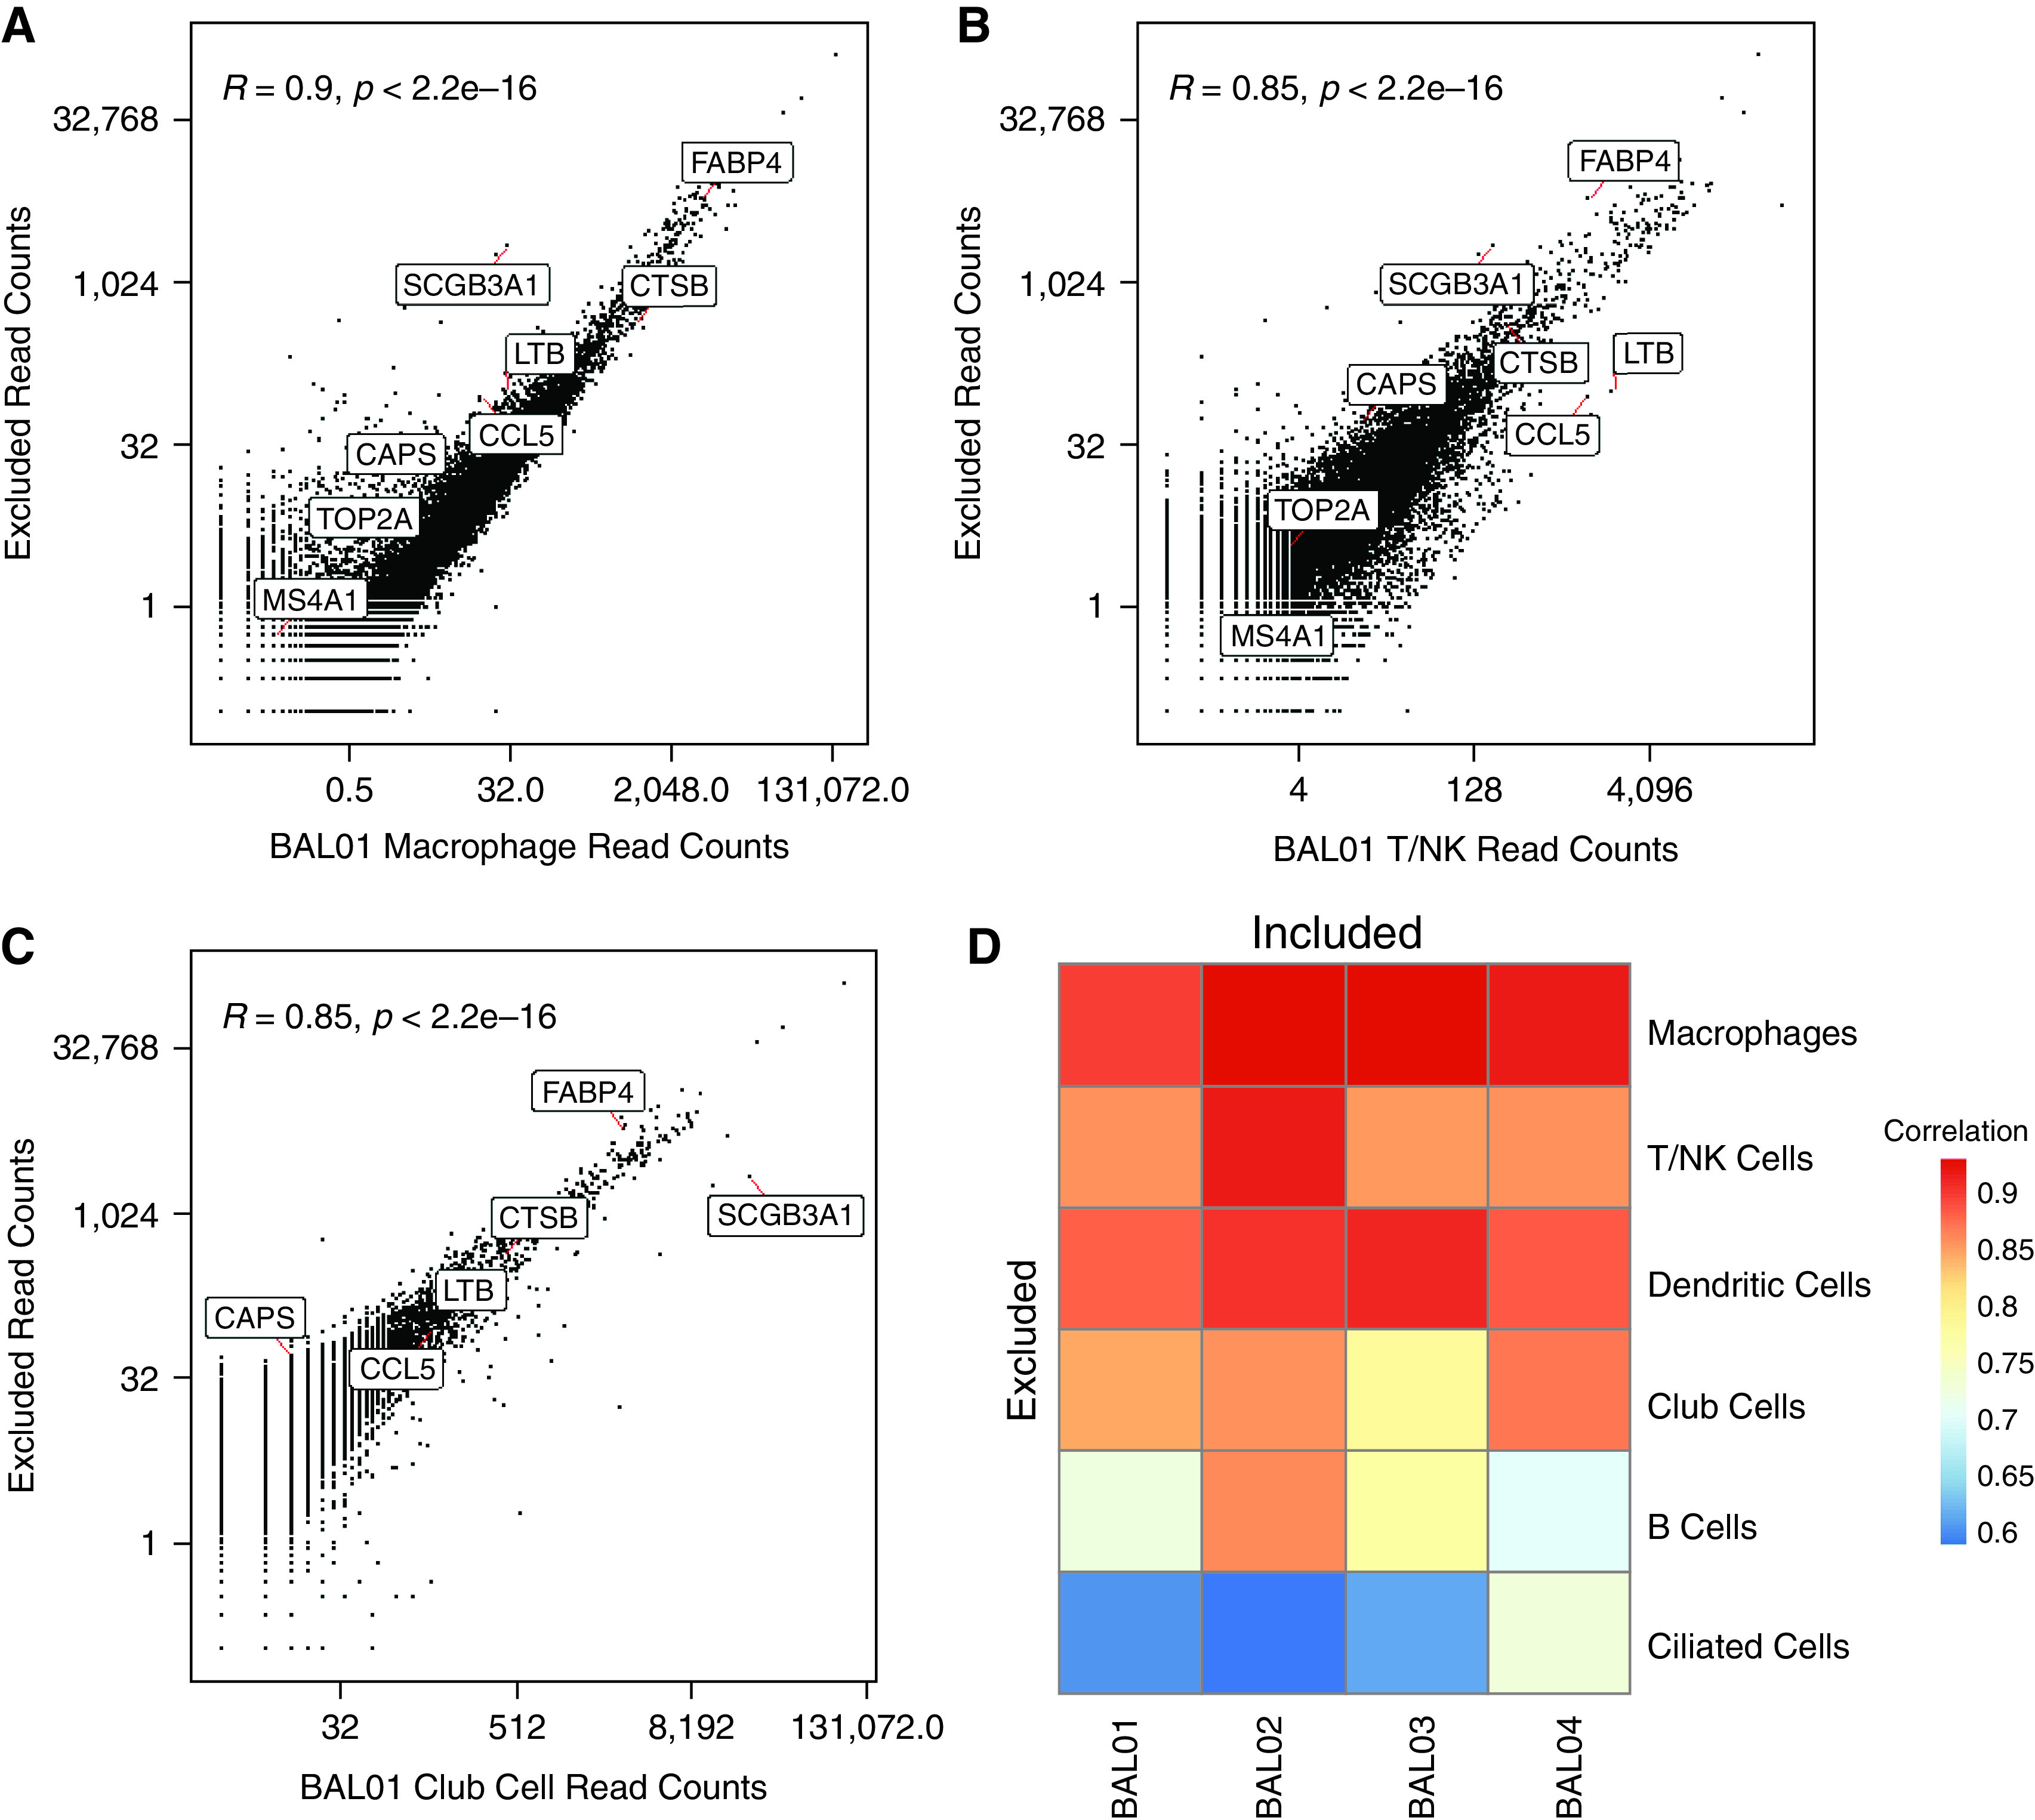
Figure 2.

Comparison of empty droplets with cell droplets to assess ambient RNA. Scatterplot of the read counts for each gene in empty droplets that are excluded from the analysis versus cells that are annotated as (A) macrophages, (B) T/NK cells, and (C) club cells in BAL01. The Pearson correlations, R, and associated P values are indicated. A few example genes representing different cell types are annotated. (D) Pearson correlation between the read counts for genes from excluded droplets versus included and annotated as one of six cell types in individual BAL samples (BAL01–04).
