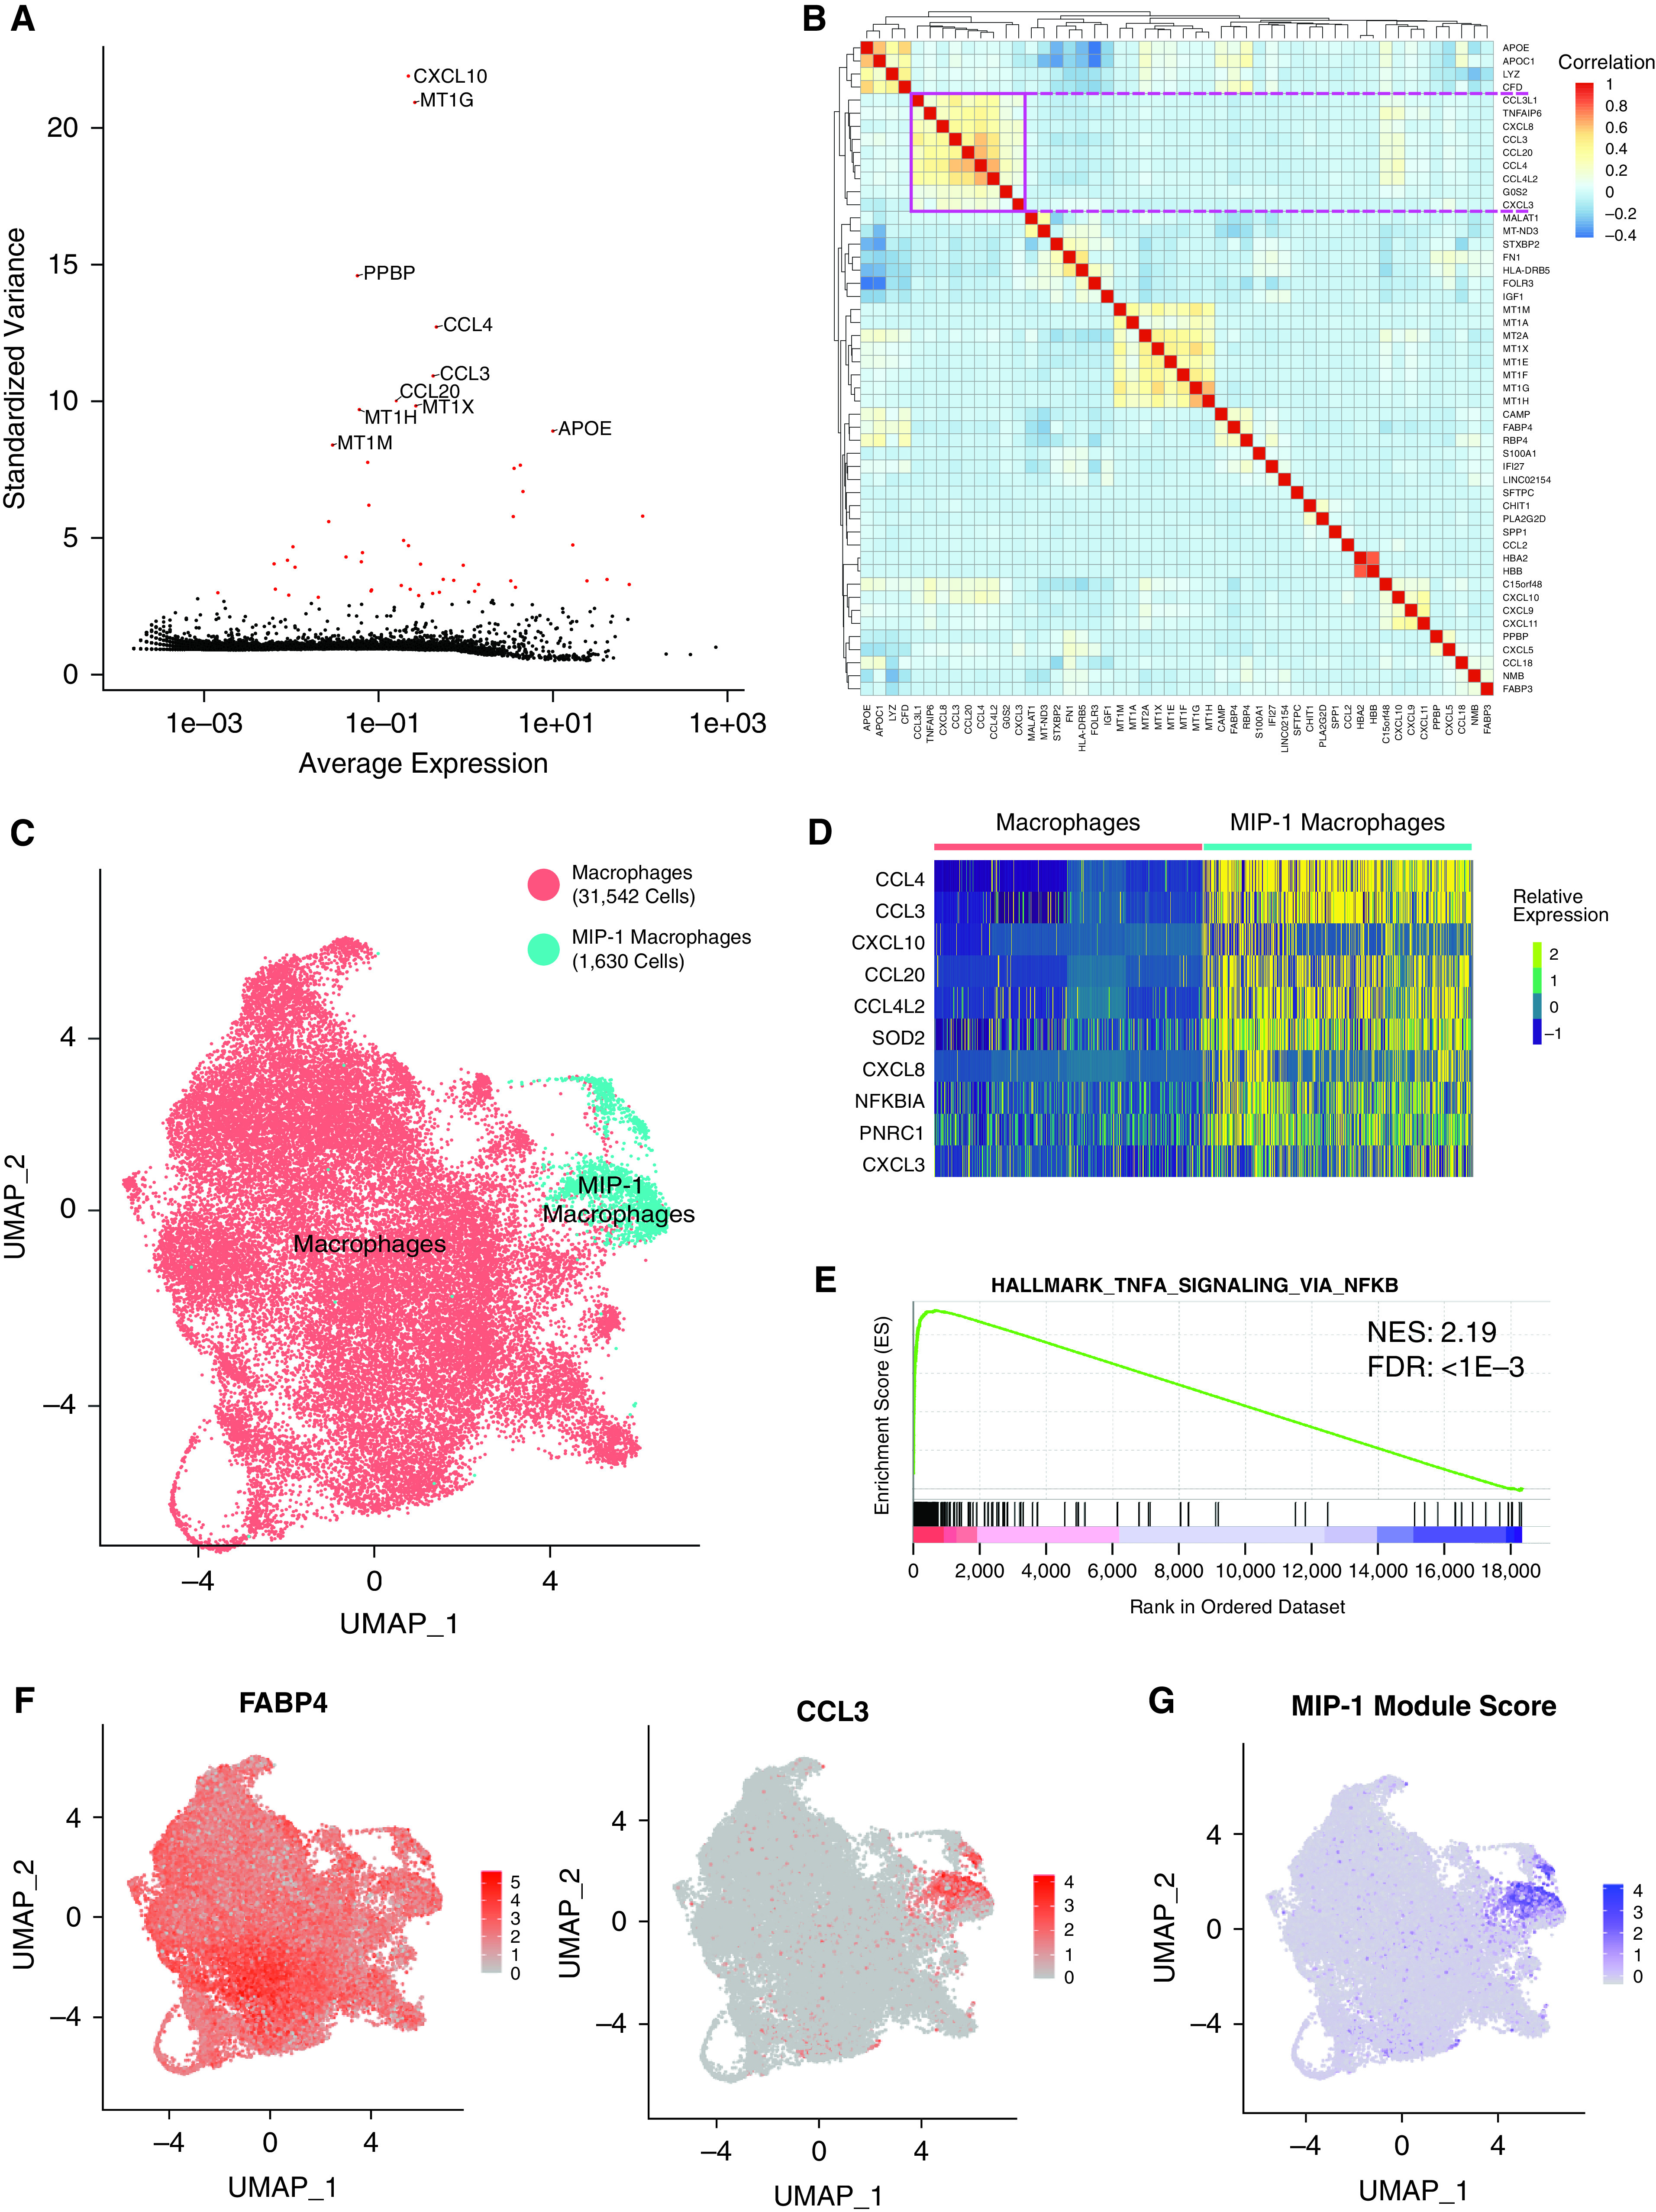
Figure 3.

Analysis of macrophage heterogeneity reveals a MIP-1 (macrophage inflammatory protein 1) subpopulation. (A) Scatterplot showing the average normalized expression of each gene by its standardized variance across macrophage cells. The top 10 most variable genes are annotated, and the top 50 most variable genes are shown in red. (B) Pairwise Pearson correlation between the expression profiles of the top 50 most variable genes across macrophages. The pink square denotes a large clade of coregulated genes. (C) UMAP representation of the transcriptional profile of macrophage cells with a subset annotated as belonging to the MIP-1 cluster. The total number of cells in each cluster is indicated in the legend. (D) Relative expression of top 10 differentially expressed marker genes (by fold change) for the MIP-1 macrophage cluster. These largely overlap but do not exactly match those in B. (E) Representative-enriched pathway resulting from GSEA analysis of marker gene list ranked by fold-change in MIP-1 compared with other macrophages. The NES and adjusted P value for the FDR are shown. (F) Visualization of normalized expression across cells for macrophage marker, FABP4, and MIP-1 gene, CCL3. (G) Visualization of MIP-1 module score across macrophage cells. All figures represent data from BAL01–04. FDR = false discovery rate; NES = Normalized Enrichment Score.
