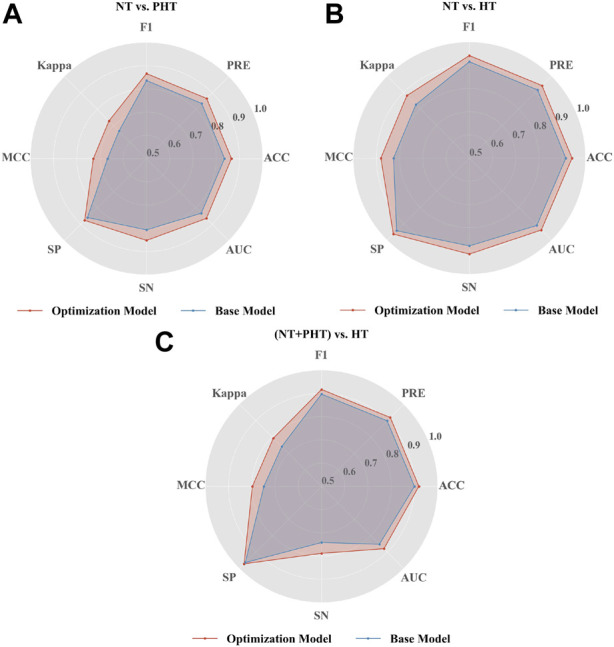
FIGURE 4.

Performance of LightGBM in the classification of hypertension. Radar plot illustrations the performance of base and optimization LightGBM model in (A) NT vs. PHT (B) NT vs. HT and (C) (NT + PHT) vs. HT. Note, NT, PHT, and HT refer to normotension, prehypertension, and hypertension, respectively. SP stands for specificity, SN stands for sensitivity, ACC stands for accuracy, PRE stands for precision, MCC stands for Matthew’s correlation coefficient, Kappa stands for Cohen’s kappa coefficient, AUC stands for Area under curve.
