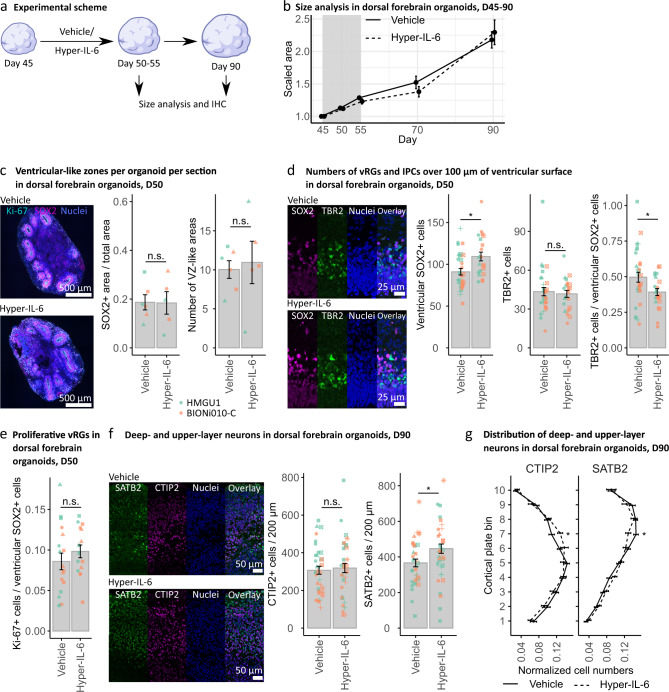
Fig. 3. Hyper-IL-6 treatment results in subtle changes in cell type composition in dorsal forebrain organoids.
a Experimental timeline and sample harvesting scheme. b Hyper-IL-6 treatment does not lead to changes in size of the DFOs during the treatment (days 45–55, grey area) and at least up to day 90 of differentiation. Vehicle (n = 5–32) and Hyper-IL-6 (n = 5–32) DFOs from one batch per iPSC line, two iPSC lines. c Hyper-IL-6 treatment does not lead to changes in the proportion of the SOX2-positive areas and the number of the VZ-like regions in the DFOs. Ki-67 (cyan), SOX2 (magenta), nuclei stained by DRAQ5 (blue). Four sections of each DFO were analyzed. Each dot represents the mean value of four sections in a single organoid. Color represents cell line of origin, HMGU1 (green), BIONi010-C (orange). Vehicle (n = 6) and Hyper-IL-6 (n = 5) DFOs from one batch per iPSC line. d Hyper-IL-6 treatment leads to an increase in SOX2-positive ventricular RGs (vRG). Hyper-IL-6 treatment does not change the number of TBR2-positive IPCs. Hyper-IL-6 treatment leads to decreased proportion of TBR2-positive IPCs over SOX2-positive vRGs. Each dot represents individual VZ/SVZ-like region, 2–6 regions imaged per organoid. Color represents cell line of origin, HMGU1 (green), BIONi010-C (orange). Shape corresponds to individual DFO. Vehicle (n = 8) and Hyper-IL-6 (n = 6) DFOs from one batch per iPSC line. e Hyper-IL-6 treatment does not lead to changes in proportion of Ki-67-positive proliferative cells over SOX2-positive vRGs. Each dot represents individual VZ-like region, 2–3 regions imaged. Color represents cell line of origin, HMGU1 (green), BIONi010-C (orange). Shape corresponds to individual DFO. Vehicle (n = 6) and Hyper-IL-6 (n = 5) DFOs from one batch per iPSC line. f Hyper-IL-6 treatment does not change the number of CTIP2-positive deep-layer excitatory neurons (dExN) at day 90 of differentiation while increasing the number of SATB2-positive upper-layer excitatory neurons (uExN). Each dot represents an individual region-of-interest representing a putative cortical plate (CP)-like region, 2-3 regions per DFO imaged. Color represents cell line of origin, HMGU1 (green), BIONi010-C (orange). Shape corresponds to individual DFO. Vehicle (n = 12) and Hyper-IL-6 (n = 14) DFOs from three batches. g Hyper-IL-6 treatment leads to incorrect laminar positioning of both CTIP2-positive dExNs and SATB2-positive uExNs at day 90 of differentiation. The cortical structure from the surface of the organoid until the end of dense CTIP2-positive area was evenly divided into bins 1–10. Shown are curves representing the normalized abundance within each bin, calculated as [#CTIP2/SATB2+ cells in a bin/#total CTIP2/SATB2+ cells]. Same samples as in f are shown. In all panels, bars (for c–f) and points (for b and g) represent mean, error bars represent ± SEM. For panels b–f, comparisons were analyzed using Aligned Rank Transform (ART) ANOVA: n.s., non-significant p-value >0.05, *p-value < 0.05. For panel g, comparisons were analyzed using t-test: *p-value < 0.05.

