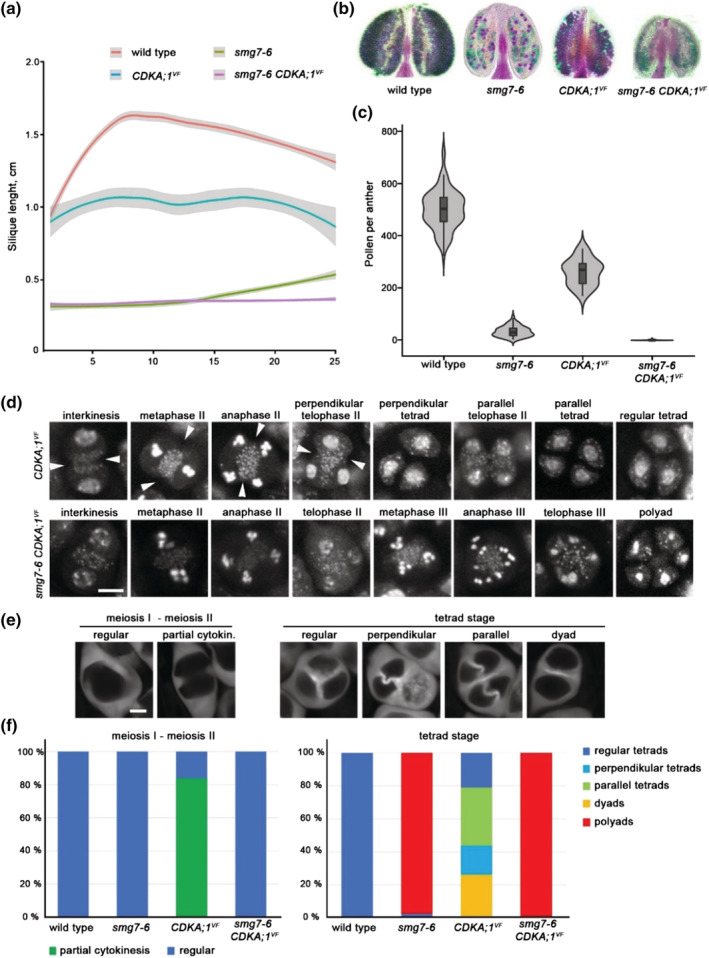
FIGURE 5.

Genetic interaction between CDKA;1 VF and smg7‐6. (a) Quantification of silique length along the main inflorescence bolt in wild type and indicated mutants (wild type n = 25, smg7‐6 n = 25, CDKA;1 VF n = 9, and CDKA;1 VF smg7‐6 n = 23 plants). The trend lines of the data were plotted by LOESS smooth function (colored lines; shaded area represents 95% confidence intervals). (b) Anthers of indicated mutants after Alexander staining. (c) Violin plots showing viable pollen per anther (wild type n = 96, smg7‐6 n = 94, CDKA;1 VF n = 30, and CDKA;1 VF smg7‐6 n = 116). (d) Cytogenetic analysis of meiosis II and cytokinesis in DAPI‐stained pollen mother cells (PMCs). Arrowheads point to cell wall invaginations prior to completion of meiosis II. Scale bar = 5 μm. (e) Callose staining of CDKA;1 VF PMCs with SR2200 dye to visualize cell wall. Scale bar = 5 μm. (f) Quantification of PMCs undergoing partial cytokinesis prior to completion of chromosome segregation (left panel; wild type n = 86, smg7‐6 n = 166, CDKD;1 VF n = 155, and smg7‐6 CDKD;1 VF n = 95) and tetrad configurations after cytokinesis (right panel; wild type n = 200, smg7‐6 n = 524, CDKD;1 VF n = 256, and smg7‐6 CDKD;1 VF n = 246)
