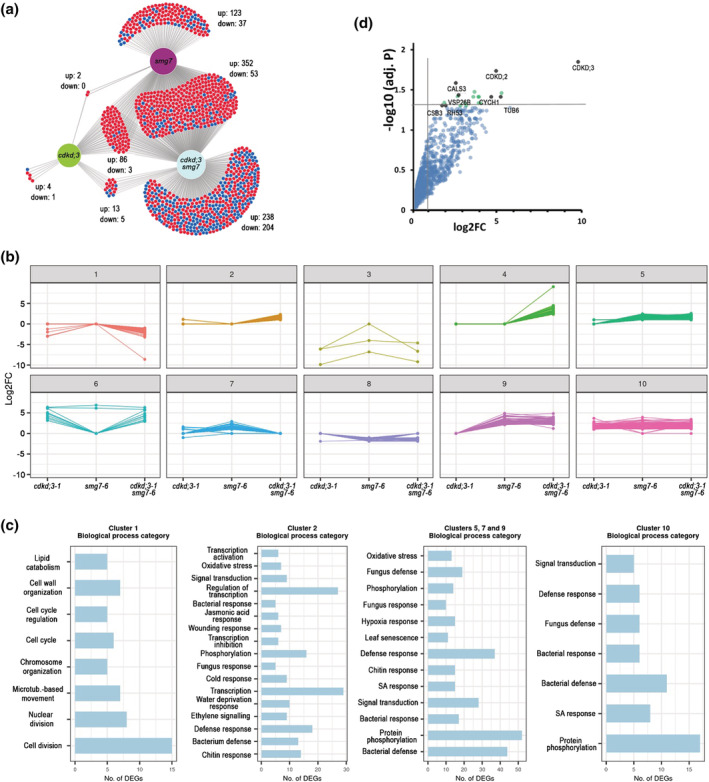
FIGURE 7.

Transcriptomics and proteomics analysis of CDKD;3. (a) Venn diagram showing overlaps between differentially expressed genes relative to wild type in cdkd;3‐1, smg7‐6, and cdkd;3‐1 smg7‐6 mutants. Numbers of up‐ and down‐regulated genes are indicated. (b) K‐means clustering of differentially expressed genes. Clustering was performed on log2FC to build expression patterns in 10 clusters for 1125 differentially expressed protein‐coding genes. (c) Subsequent gene ontology term (GO‐term) enrichment analysis of selected clusters. Genes in the clusters were analyzed with regard to their biological function by GO enrichment analysis (p‐value <.05; Benjamini–Hochberg test). Most enriched GO categories are shown for representative categories of clusters. (d) Dot plot of proteins identified by LC–MS in pull‐downs from wild type and CDKD;3:YFP expressing plants using Green fluorescent protein (GFP) antibody. Proteins with the highest confidence of enrichment are indicated as black dots. Fold change (log2FC) and significance of the difference between wild type and CDKD;3:YFP samples are plotted.
