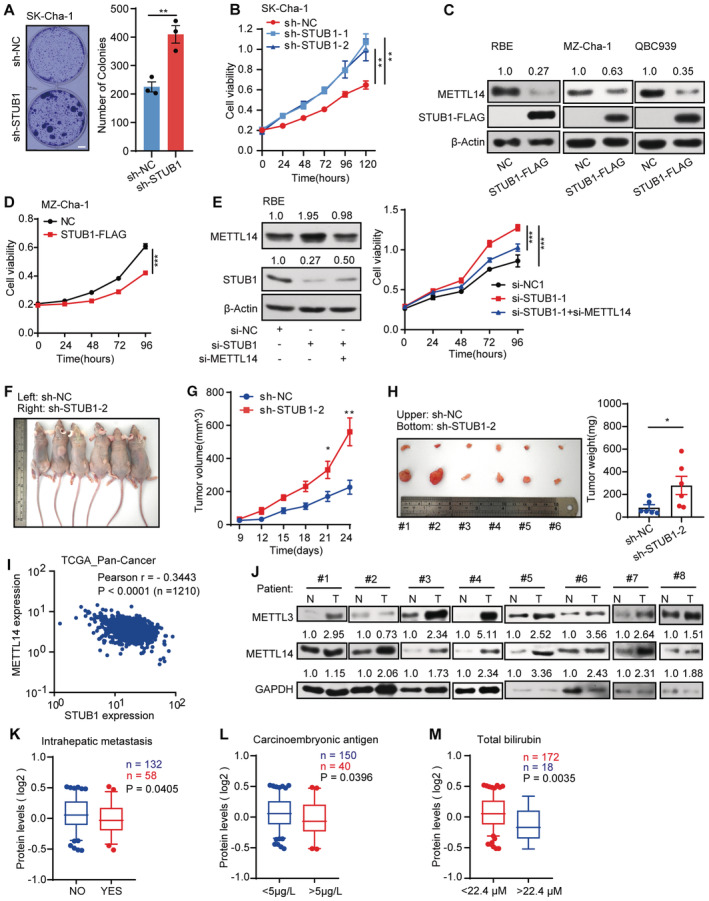
Figure EV5. STUB1‐mediated degradation of METTL14 can suppress CCA progression and has potential clinical relevance.

-
AMorphology of colonies of Sk‐Cha‐1 cells upon shRNA‐mediated STUB1 knockdown. Data are mean ± SEM of three biological replicates and were analyzed by two‐tailed unpaired t‐test. (**P < 0.01).
-
BCCK‐8 assays showing cell viability after shRNA‐mediated STUB1 knockdown. Data are mean ± SEM of three biological replicates and were analyzed by two‐way ANOVA. (**P < 0.01).
-
CImmunoblots showing METTL14 protein levels in CCA cells overexpressing STUB1‐FLAG. β‐actin was used as the loading control. The METTL14 /β‐actin densitometric ratio was recorded by ImageJ.
-
DCCK‐8 assays showing cell viability in MZ‐Cha‐1 cells overexpressing STUB1. Data are mean ± SEM of three biological replicates and were analyzed by two‐way ANOVA (***P < 0.001).
-
EImmunoblots showing METTL14 protein levels under STUB1 knockdown and METTL14 knockdown (left panel) in RBE cells. β‐actin was used as the loading control. The METTL14 or STUB1/β‐actin densitometric ratio was recorded by ImageJ. CCK‐8 assays showing cell viability upon the function of METTL14 in STUB1 knockdown cells (right panel). Data are mean ± SEM of three biological replicates and were analyzed by two‐way ANOVA (***P < 0.001).
-
F–HFollowing the subcutaneous inoculation of SK‐Cha‐1‐sh‐NC (left) and SK‐Cha‐1‐sh‐STUB1‐2 (right) cells into the flanks of male nude mice (F), STUB1 knockdown promoted the proliferation of malignant cells (G) and increased subsequent tumor size and growth (H). Data are mean ± SEM. Statistical significance was analyzed by two‐way ANOVA (G) and two‐tailed unpaired t‐test (H) (Six mice, *P < 0.05; **P < 0.01).
-
IPan‐cancer analysis using TGCA data sets consisting of 1,210 patient samples showing that METTL14 and STUB1 expression is negatively correlated (Pearson's correlation coefficient − 0.3443, P < 0.001).
-
JImmunoblot analysis showing METTL3 and METTL14 protein levels in eight pairs of CCA patient samples. N, adjacent non‐tumor tissue; T, tumor tissue. GAPDH was used as the loading control. The METTL3 or METTL14 /GAPDH densitometric ratio was recorded by ImageJ.
-
K–MSTUB1 protein levels are low in patient samples with high carcinoembryonic antigen and total bilirubin, and intrahepatic metastasis in the Fudan University intrahepatic cholangiocarcinoma (FU‐iCCA) cohort (using patient samples from the 5–95% bin according to STUB1 protein levels; a two‐tailed unpaired t‐test was used). In the boxplot, the central band indicates the median, the box indicates the interquartile range, and the whiskers indicate the 5–95% percentile.
Source data are available online for this figure.
