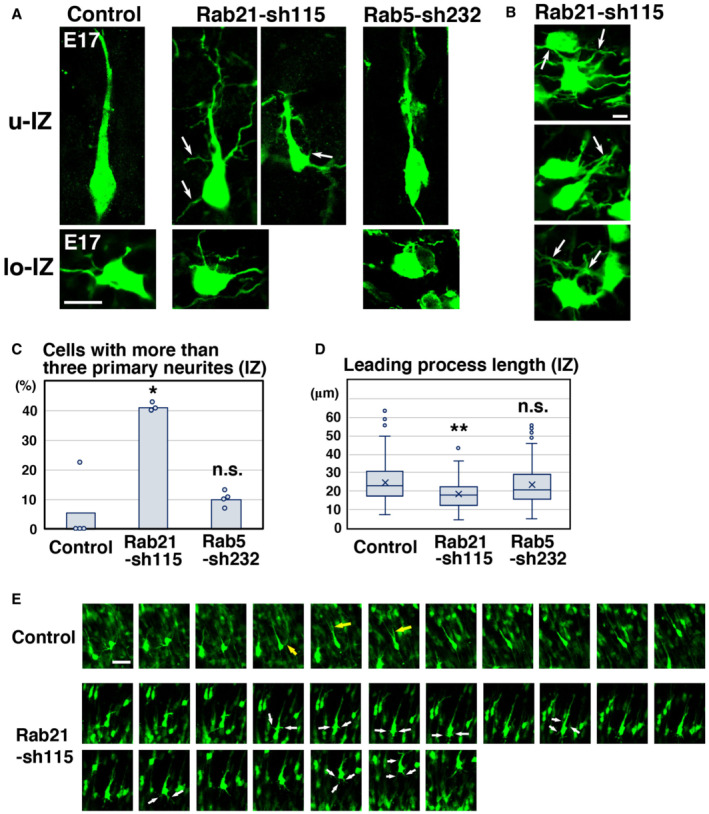
Figure 2. Rab5 and Rab21 have distinct functions in vivo .

-
A–DCerebral cortices at E17, electroporated with the indicated plasmids plus pCAG‐EGFP at E14. (A) High magnification images of the upper intermediate zone (u‐IZ) or lower intermediate zone (lo‐IZ) of the cerebral cortices. White arrows indicate abnormal primary neurites. (B) High magnification images of the lower IZ of the cerebral cortices. White arrows indicate sticky neurites. (C) The ratio of locomoting neurons with more than three primary neurites in the IZ. Each score represents the mean with the individual points. Control: n = 4 brains (60 cells), Rab21‐sh115: n = 3 brains (65 cells), Rab5‐sh232: n = 4 brains (111 cells). (D) The box‐and‐whisker plot shows average leading process length of the locomoting neurons in the IZ. Control: n = 100 cells, Rab21‐sh115: n = 80 cells, Rab5‐sh232: n = 111 cells.
-
ETime‐lapse imaging of control and Rab21‐sh115‐electroporated cells in cortical slices from E16 cerebral cortices, electroporated with the indicated plasmids at E14. After formation of the leading process, control neurons rapidly eliminated their immature neurites (yellow arrows), whereas the Rab21‐knockdown neurons retained the immature neurites (white arrows) for long periods. Time interval of each frame is 30 min.
Data information: (C) Significance compared to control was determined by Mann–Whitney's U test (Control vs. Rab21‐sh232: P = 0.02771, Control vs. Rab5‐sh232: P = 0.2367) and Welch's t‐test (Control vs. Rab21‐sh232: P = 0.007987, Control vs. Rab5‐sh232: P = 0.4819). *P < 0.05, n.s.: no significant differences. (D) In the box‐and‐whisker plots, the central band and the upper and lower sides of the boxes indicate the median and the upper and lower quartiles. The whiskers of the depicted boxplots go from the minimum to the lower quartile and from the upper quartile to the maximum. “x” indicates the average value. Significance compared to control was determined by Mann–Whitney's U test (Control vs. Rab21‐sh232: P = 0.00006332, Control vs. Rab5‐sh232: P = 0.5213) and Welch's t‐test (Control vs. Rab21‐sh232: P = 0.00001667, Control vs. Rab5‐sh232: P = 0.4581). **P < 0.01, n.s.: no significant differences. Scale bars: 10 μm in (A), 2 μm in (B), 20 μm in (E).
