
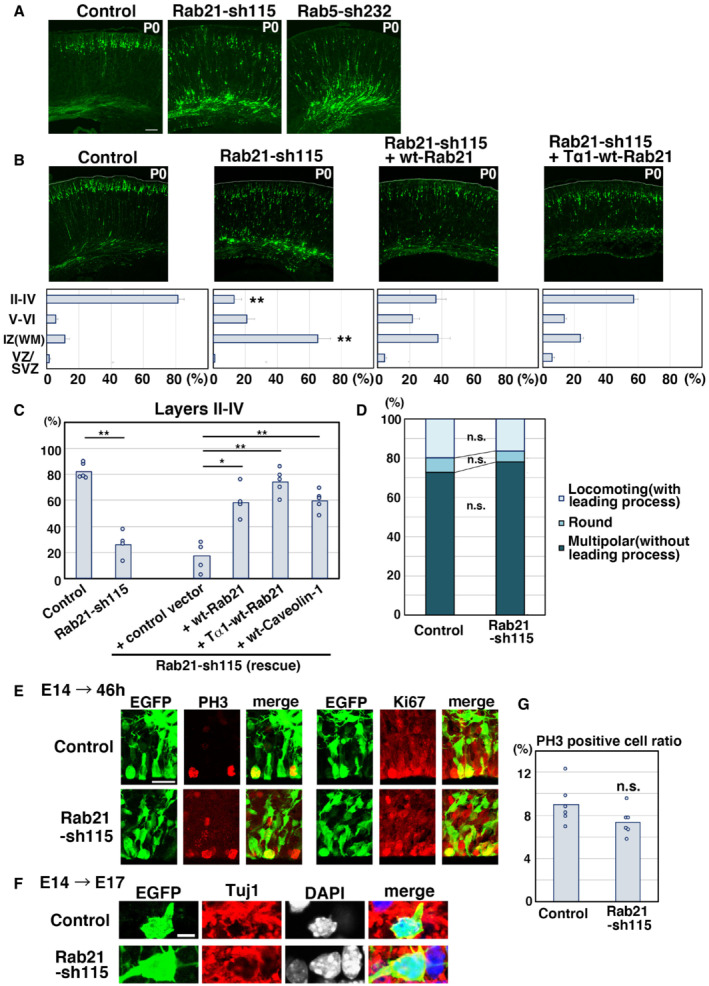
Figure EV2. Knockdown of Rab21, as well as Rab5, suppresses cortical neuronal migration, but not the proliferation and differentiation of neural progenitors.
-
A, BCerebral cortices at P0, electroporated with the indicated plasmids plus pCAG‐EGFP at E14. The lower graphs in (B) show the estimation of cell migration, which was carried out by recording fluorescence intensities of EGFP in distinct regions of the cerebral cortices using Leica SP5 software. Each bar represents the mean percentage of relative intensities ± SEM. Control: n = 6 brains, Rab21‐sh115: n = 5 brains, Rab21‐sh115 + pCAG‐wt‐Rab21: n = 5 brains, Rab21‐sh115 + pTα1‐wt‐Rab21: n = 6 brains. II‐IV, layers II‐IV of the cortical plate; IZ, intermediate zone; SVZ/VZ, subventricular zone/ventricular zone; V‐VI, layers V‐VI of the cortical plate; WM, white matter.
-
CThe ratio of the number of the electroporated cells in the upper layers (layers II–IV). Each score represents the mean of ratios with the individual points. Control: n = 5 brains, Rab21‐sh115: n = 4 brains, Rab21‐sh115 + control vector: n = 5 brains, Rab21‐sh115 + CAG‐wt‐Rab21: n = 4 brains, Rab21‐sh115 + Tα1‐wt‐Rab21: n = 5 brains, Rab21‐sh115 + wt‐Caveolin‐1: n = 5 brains. The sample numbers show biological replicates. In case of co‐electroporation with wt‐Rab21 driven by CAG promoter, the Rab21‐sh115‐mediated migration defect was partially rescued, but its efficiency was lower than that of Tα1‐wt‐Rab21, implicating that excess Rab21 in neural progenitors might have a negative effect on proper neuronal positioning.
-
DCerebral cortices at E17, electroporated with the indicated plasmids plus pCAG‐EGFP at E14. The graph shows the ratio of cells with the indicated morphology in the IZ. Control and Rab21‐sh115: n = 3 brains.
-
E–GCerebral cortices at E16 (46 h after electroporation) (E and G) and E17 (F), electroporated with the indicated plasmids plus pCAG‐EGFP at E14. Frozen sections were immunostained with anti‐EGFP and anti‐phospho‐Histone H3 (left panels in E) or anti‐Ki67 (right panels in E) or anti‐Tuj1 (F) antibodies. Blue alone channels are shown in black and white images. The graph in (G) shows the ratio of phospho‐Histone H3‐positive cells in the electroporated cells in the VZ. Each score represents the mean of ratios with the individual points. Control: n = 6 brains (762 cells), Rab21‐sh115: n = 6 brains (374 cells).
Data information: (B) Significance compared to control was determined by Student's t‐test (Rab21‐sh115 [Layer II–IV]: P = 0.000001254, Rab21‐sh115 [IZ]: 0.00008495). **P < 0.01. (C) Significance was determined by one‐way ANOVA with post hoc Tukey–Kramer test. *Less than the critical value at 5% (Control vs. Rab21‐sh115 + ppCAG‐wt‐Rab21, Control vs. Rab21‐sh115 + pCAG‐wt‐Caveolin‐1), **less than the critical value at 1% (Control vs. Rab21‐sh115, Control vs. Rab21‐sh115 + control vector, Rab21‐sh115 vs. Rab21‐sh115 + pCAG‐wt‐Rab21, Rab21‐sh115 vs. Rab21‐sh115 + pTα1‐wt‐Rab21, Rab21‐sh115 vs. Rab21‐sh115 + pCAG‐wt‐Caveolin‐1, Rab21‐sh115 + control vector vs. Rab21‐sh115 + pCAG‐wt‐Rab21, Rab21‐sh115 + control vector vs. Rab21‐sh115 + pTα1‐wt‐Rab21, Rab21‐sh115 + control vector vs. Rab21‐sh115 + pCAG‐wt‐Caveolin‐1). (D) No significant differences (n.s.) between control and Rab21‐sh115‐electroporated neurons were found by Mann–Whitney's U test and Student's t‐test (Locomotion: P = 0.5127 or 0.4841, Round: P = 0.1266 or 0.1916, Multipolar: P = 0.2752 or 0.1786, respectively). (G) Significance compared to control was determined by Student's t‐test (P = 0.1149). n.s.: no significant differences. Scale bars: 100 μm in (A, B). 25 μm in (E), 5 μm in (F).