
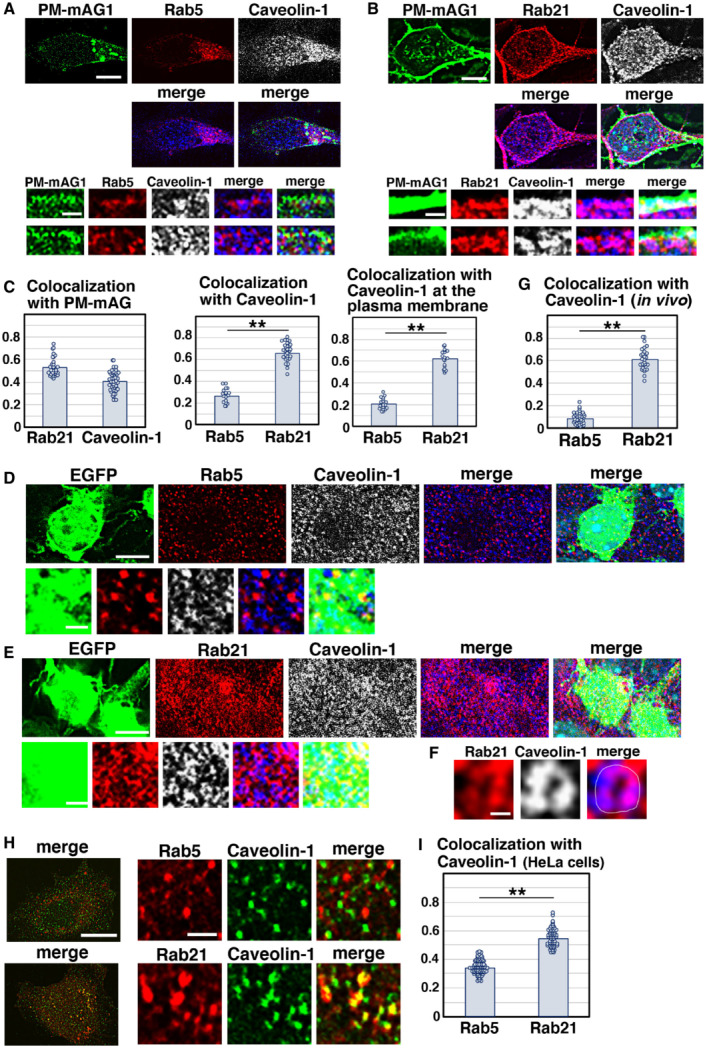
Figure 3. Rab21 prefers to co‐localize with caveolin‐1 in cortical neurons.
-
A–CPrimary cortical neurons from E15 cerebral cortices were transfected with pCAG‐PM‐mAG1 (green) and incubated for 2 days in vitro. Cells were immunostained with the indicated antibodies (red and blue/white). The transfected PM‐mAG1 is a marker for the plasma membrane. The images are obtained with high‐resolution microscopy (Nikon) and the lower panels are high magnification images near the plasma membrane. Blue alone channels are shown in black and white images. The graphs in (C) show the Pearson's correlation coefficient between PM‐mAG1 and Rab21 or Caveolin‐1 (left) and between caveolin‐1 and Rab5 or Rab21 in whole cells (middle) or at the plasma membrane (right). Each score represents the mean of ratios with the individual points. Rab5: n = 18 cells (middle and right), Rab21: n = 31 cells (left and middle) or 20 cells (right), Caveolin‐1: n = 43 cells (left).
-
D–GImmature neurons in the IZ of the cerebral cortices at E17, electroporated with pCAG‐EGFP at E14. Frozen sections were immunostained with the indicated antibodies. The images are obtained with high‐resolution microscopy (Nikon). Blue alone channels are shown in black and white images. The images in (F) are high magnification images of (E). The graph in (G) shows the Pearson's correlation coefficient between caveolin‐1 and Rab5 or Rab21. Each score represents the mean of ratios with the individual points. Rab5: n = 38 cells, Rab21: n = 28 cells.
-
H, IHeLa cells were immunostained with the indicated antibodies. The images are obtained with high‐resolution microscopy (Nikon). The graph in (I) shows the Pearson's correlation coefficient between caveolin‐1 and Rab5 or Rab21. Each score represents the mean of ratios with the individual points. Rab5: n = 80 cells, Rab21: n = 62 cells.
Data information: (C) Significance was determined by Student's t‐test (Middle: P = 9.144E‐22, Right: P = 2.309E‐19). **P < 0.01. (G) Significance was determined by Welch's t‐test (P = 1.225E‐25). **P < 0.01. (I) Significance was determined by Welch's t‐test (P = 3.209E‐40). **P < 0.01. Scale bars: 3 μm in (upper panels in A, B, D, E), 0.5 μm in (lower panels in A, B, D, E), 0.1 μm in (F), 10 μm in (left panels in H), 1 μm in (right panels in H).