
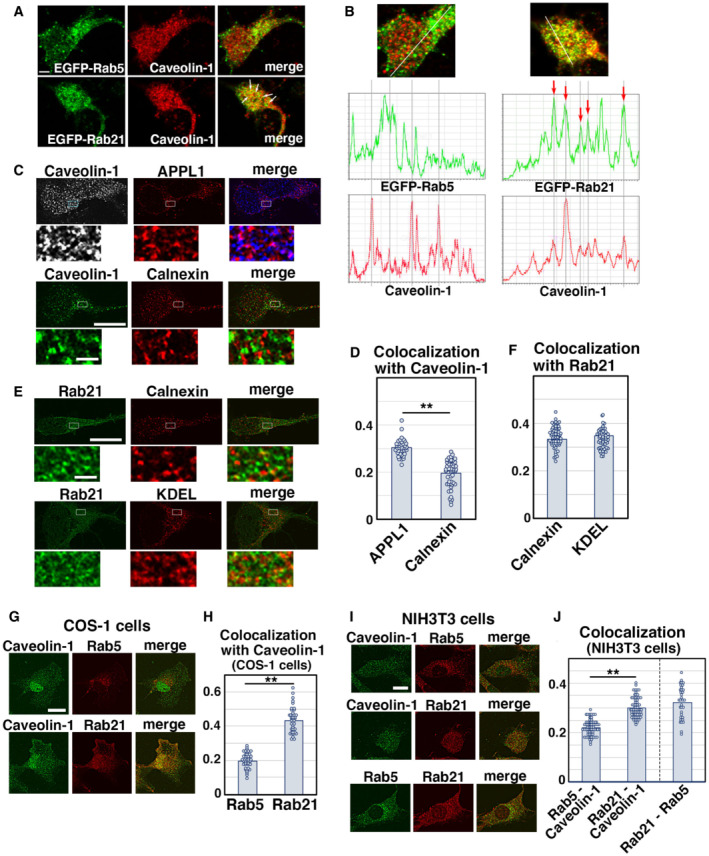
Figure EV3. Subcellular localization of Rab21 and caveolin‐1 in primary cortical neurons and nonneuronal cultured cells.
-
A, BPrimary cortical neurons from E15 cerebral cortices were transfected with EGFP‐Rab5 (upper panels in A) or EGFP‐Rab21 (lower panels in A) and incubated for 2 days in vitro. To maintain moderate expression levels, CMV promoter was used to express EGFP‐Rab5 and EGFP‐Rab21. Cells were immunostained with anti‐EGFP (green) and anti‐caveolin‐1 (red) antibodies. White arrows in (A) indicate colocalization of EGFP‐Rab21 and caveolin‐1. The images are obtained with TCS‐SP5 (Leica). The graphs in (B) show the estimation of colocalization, which was carried out by recording fluorescence intensities of EGFP‐Rab5 or EGFP‐Rab21 and caveolin‐1 staining signals along the white line in the upper panels using Leica SP5 software. Red arrows indicate the colocalization of these proteins on the same peaks.
-
C–FPrimary cortical neurons from E15 cerebral cortices were transfected with the indicated plasmids, incubated for 2 days in vitro and immunostained with the indicated antibodies. Lower panels in (C) and (E) are high magnification images indicated by white and blue rectangles in upper panels. Blue alone channels are shown in black and white images. The graphs in (D) and (F) show the Pearson's correlation coefficient between caveolin‐1 (D) or Rab21 (F) and organelle markers. Each score represents the mean with the individual points. Caveolin‐1—APPL1: n = 38 cells, Caveolin‐1—calnexin: n = 51 cells, Rab21—calnexin: n = 59 cells, Rab21—KDEL: n = 51 cells.
-
G–JNIH3T3 or COS‐1 cells were immunostained with the indicated antibodies. The images are obtained with high‐resolution microscopy (Nikon). The graphs in (H) and (J) show the Pearson's correlation coefficient between caveolin‐1 and Rab5 or Rab21 or between Rab21 and Rab5. Each score represents the mean with the individual points. Caveolin‐1—Rab21: n = 41 cells (H) or 63 cells (J), Caveolin‐1—Rab5: n = 63 cells (H) or 69 cells (J), Rab21—Rab5: 34 cells.
Data information: (D) Significance was determined by Mann–Whitney's U test (P = 1.310E‐14, **P < 0.01). (F) Significance was determined by one‐way ANOVA with post hoc Tukey–Kramer. No significant difference was observed between Rab21—Calnexin and Rab21—KDEL, but compared to a negative control (Rab5—Lamp1 in Fig 1B), a significant difference was observed (less than the critical value at 1%: Rab21—calnexin, Rab21—KDEL [compared to a negative control]). (H, J) Significance between Caveolin‐1—Rab21 and Caveolin‐1—Rab5 was determined by Welch's t‐test (H: P = 5.795E‐27, J: P = 7.367E‐24). **P < 0.01. Scale bar: 3 μm in (A), 10 μm in (upper panels in C, E), 1 μm in (lower panels in C, E), 5 μm in (G, I).