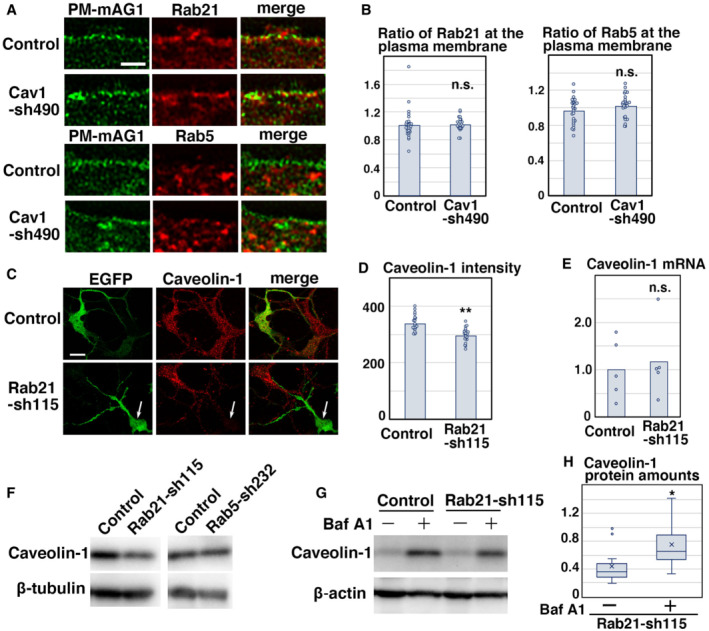
Figure EV5. Knockdown of Rab21, but not Rab5, decrease the caveolin‐1 protein levels.

-
A, BPrimary cortical neurons from E15 cerebral cortices were transfected with the indicated plasmids plus pCAG‐PM‐mAG1 (green) and incubated for 2 days in vitro. Immunocytochemical analyses with anti‐Rab21 or anti‐Rab5 antibody (red) were performed. The graphs in (B) indicate the ratio of the Rab21 or Rab5 staining signals in the plasma membrane to total fluorescence intensities in each immature neuron. Each score represents the mean with the individual points. Control: n = 29 cells (left, Rab21) or 27 cells (right, Rab5), Cav1‐sh490: n = 24 cells (left, Rab21) or 25 cells (right, Rab5).
-
C, DPrimary cortical neurons from E15 cerebral cortices transfected with the indicated plasmids plus pCAG‐EGFP and incubated for 2 days in vitro. Immunocytochemical analyses with anti‐EGFP (green) and anti‐caveolin‐1 (red) antibodies (C, D) and quantitative PCR (E) were performed. White arrows in (C) indicate the Rab21‐knockdown neurons with decreased caveolin‐1 signals. The graph in (D) shows the fluorescence intensity of caveolin‐1 per cell. Each score represents the mean with the individual points. Control: n = 21 cells, Rab21‐sh115: n = 22 cells. Each score in (E) represents the ratio with the individual points.
-
FPrimary cortical neurons from E15 cerebral cortices transfected with the indicated plasmids and incubated for 5 days in vitro (DIV). Immunoblot analyses of cell lysates with the indicated antibodies were performed. Long‐term culture (5 DIV) did not affect the protein levels of caveolin‐1 in the Rab5‐sh232‐transfected cortical neurons, similar to the 2 DIV neurons (Fig 6E), whereas the reduced caveolin‐1 protein levels were still observed in the Rab21‐sh115‐transfected neurons at 5 DIV.
-
G, HPrimary cortical neurons from E15 cerebral cortices transfected with the indicated plasmids, incubated for 1 DIV and treated with 160 nM Bafilomycin A1 (Baf A1) for 22 h. Immunoblot analyses of the cell lysates with the indicated antibodies were performed. The box‐and‐whisker plot in (H) shows the ratios of immunoblot band intensities of caveolin‐1/beta‐actin. Baf A1−: n = 11 biological replicates, Baf A1+: n = 10 biological replicates.
Data information: (B) Significance was determined by Mann–Whitney's U test (Rab21: P = 0.2176) or Student's t‐test (Rab5: P = 0.1599), and no significant difference was observed. n.s.: no significant differences. (D) Significance was determined by Student's t‐test (P = 0.000004220). **P < 0.01. (E) Significance was determined by Welch's t‐test (n = 5 biological replicates, P = 0.7262). n.s.: no significant differences. (H) In the box‐and‐whisker plots, the central band and the upper and lower sides of the boxes indicate the median and the upper and lower quartiles. The whiskers of the depicted boxplots go from the minimum to the lower quartile and from the upper quartile to the maximum. “x” indicates the average value. Significance was determined by Welch's t‐test (P = 0.03234). *P < 0.05. Scale bar: 1 μm in (A), 10 μm in (C).
