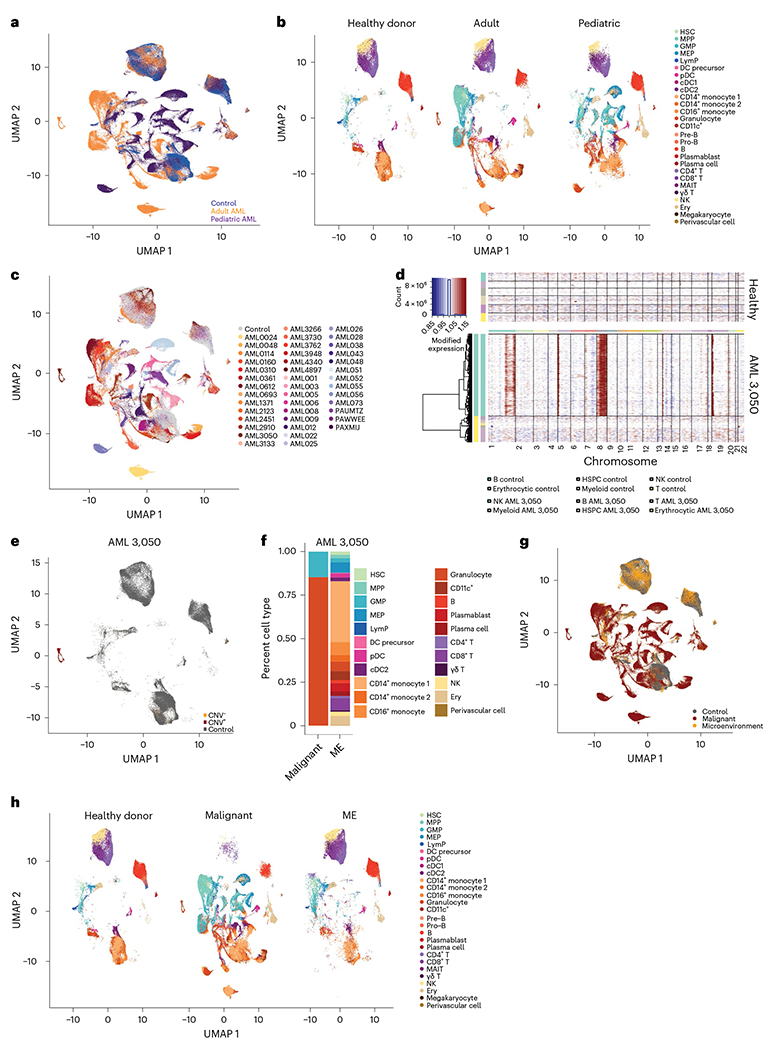
Fig. 1 |. The single-cell landscape of adult and pediatric AML.

a, UMAP projection of healthy donors (n = 10), adult (n = 20) and pediatric (n = 22) AML BM cells. b, Split UMAP projection of healthy donors (n = 10), adult (n = 20) and pediatric (n = 22) AML cells, annotated by cell type based on transcriptome and surface protein expression. MEP, megakaryocyte progenitor; LymP, lymphoid progenitor; DC, dendritic cell; Ery, erythrocyte. c, UMAP representation of cells from healthy donors (n = 10, gray) or patients with AML (n = 42, colored), highlighting patient-specific clusters in AML. d, InferCNV heat map demonstrating copy gains in chromosomes 1, 5, 8 and 19 for sample AML 3050. e, UMAP projection of control, CNV+and CNV− cells from sample AML 3050.Gray indicates healthy donor cells (n = 10). f, Quantification of malignant and microenvironment (ME) cells from sample AML 3050. g, UMAP projection of healthy donors (n = 10), malignant and microenvironment cells from patients with AML (n = 37), following inferCNV and occupancy score analysis. h, Split UMAP projection of annotated cells from healthy donors (n = 10), malignant and microenvironment populations (n = 37 patients with AML) in the BM. All UMAP projections are based on the same coordinates.
