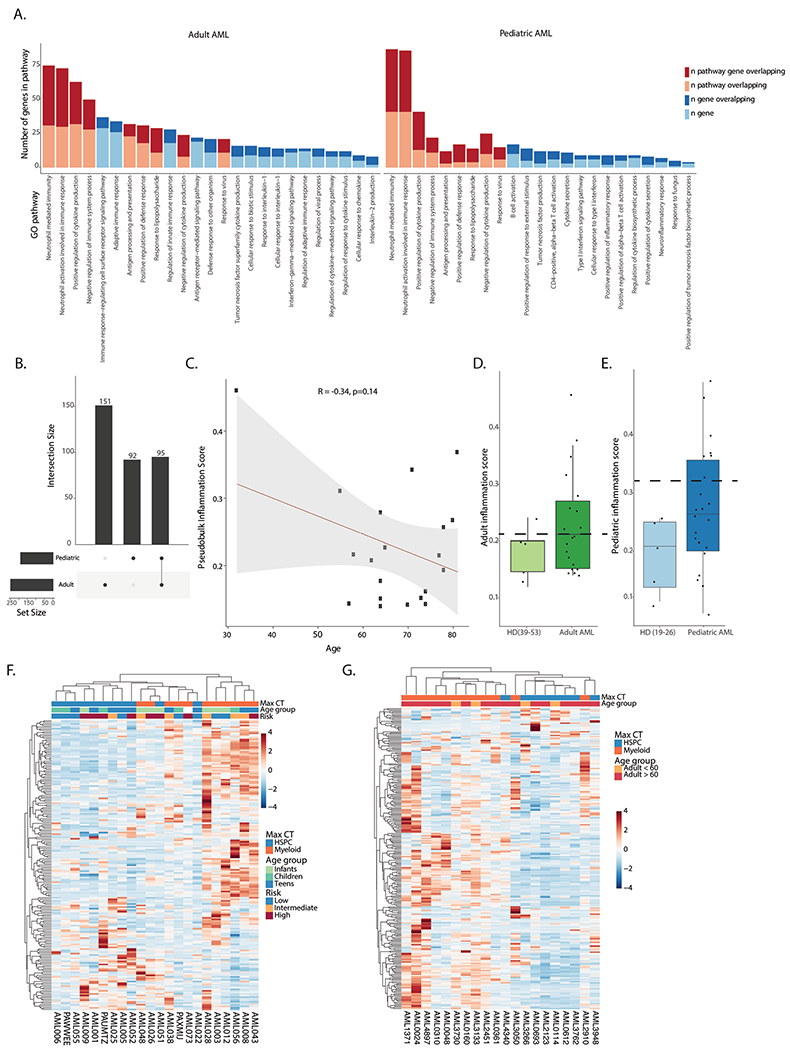
Extended Data Fig. 6 |. Inflammatory signatures in AML.

a. Pathway analysis for genes in the adult (left) and pediatric (right) inflammation signatures. b. Overlap between genes in the adult and pediatric inflammation signatures. c. Pearson correlation between age and inflammation score in the adult AML cohort. d. Inflammation score in older controls (n = 5) and adult AML patients (n = 20) in the single cell cohort. Dashed line represents cutoff for high or low inflammation. Box plots represent the median with the box bounding the interquartile range (IQR) and whiskers showing the most extreme points within 1.5× IQR. e. Inflammation score in younger controls (n = 5) and pediatric AML patients (n = 22). Dashed line represents cutoff for high or low inflammation. Box plots represent the median with the box bounding the interquartile range (IQR) and whiskers showing the most extreme points within 1.5× IQR. f. Heatmap of average expression of the pediatric inflammation signature in malignant cells from pediatric patients. Max CT – maximum cell count. Infants – 0–3 years old (n = 6), children – 3–12 years old (n = 9), teens − 12–21 years old (n = 7). g. Heatmap of average expression of the adult inflammation signature in malignant cells from adult patients. Max CT – maximum cell type.
