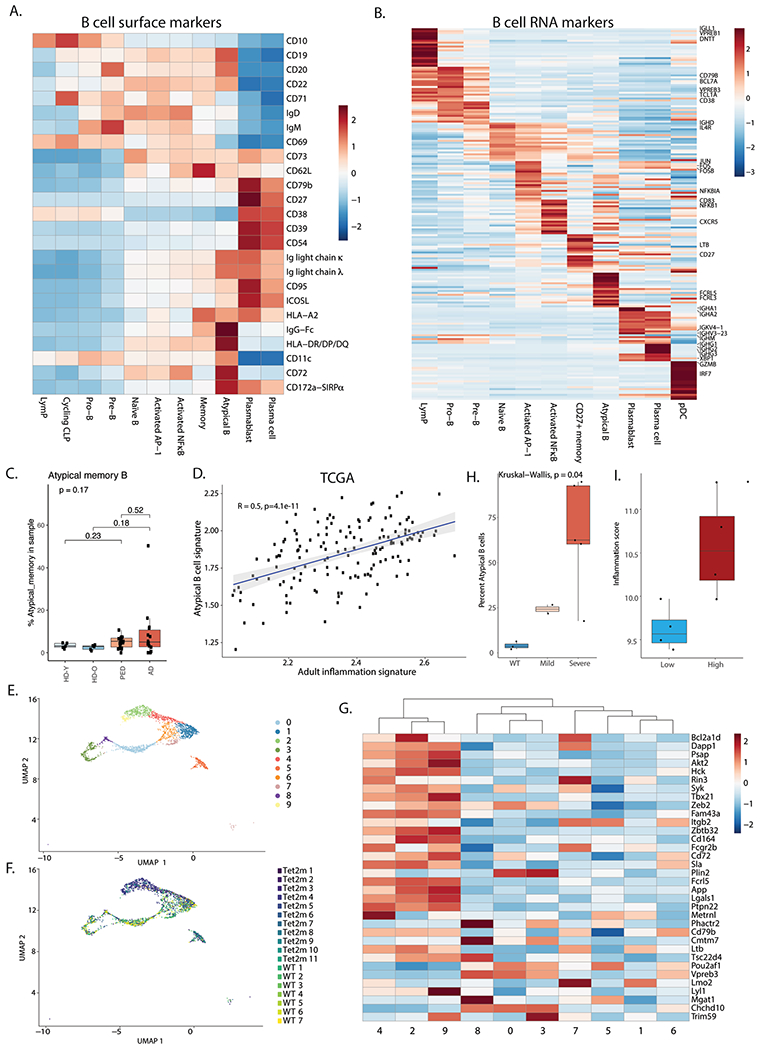
Extended Data Fig. 7 |. Inflammatory B cells in AML.

a. Heatmap of average expression of surface protein markers in different B cell subsets. CLP – common lymphoid progenitor. b. Heatmap of average expression of RNA markers in different B cell subsets. c. Quantification of Atypical B cells split by young healthy donor (n = 5), older healthy donors (n = 5) adult (n = 14) and pediatric (n = 19) AML patients. Note the reduction in patient numbers due to exclusion of patients with less than 50 B cells in the BM. Box plots represent the median with the box bounding the interquartile range (IQR) and whiskers showing the most extreme points within 1.5 × IQR. d. Pearson correlation between the atypical B cell gene signature and the adult inflammation signature in the TCGA cohort (n = 152). e. UMAP representation of B cells from wild type (WT, n = 7) and Tet2 mutant (n = 11) mouse BM. f. UMAP representation of wild type (WT, n = 7) and Tet2 mutant (n = 11) cell distribution in B cell clusters. g. Heatmap showing expression of the mouse atypical B cell gene signature in B cell clusters in wild type (WT, n = 7) and Tet2 (n = 11) mutant mouse BM. h. Quantification of atypical B cells in aged wild type (WT, n = 3) or Tet2 mutant mice (n = 7). Mild – mild disease (n = 2), severe – severe disease (n = 5). Statistical tests in this panel are two-sided. Box plots represent the median with the box bounding the interquartile range (IQR) and whiskers showing the most extreme points within 1.5 × IQR. i. Inflammation scores of samples used for FACS validation of atypical B cell expansion in high inflammation AML BM (high inflammation n = 4, low inflammation n = 4). Box plots represent the median with the box bounding the interquartile range (IQR) and whiskers showing the most extreme points within 1.5× IQR. All pair-wise comparisons were evaluated using Wilcoxon test, multi-group comparisons were evaluated using Kruskal-Wallis test.
