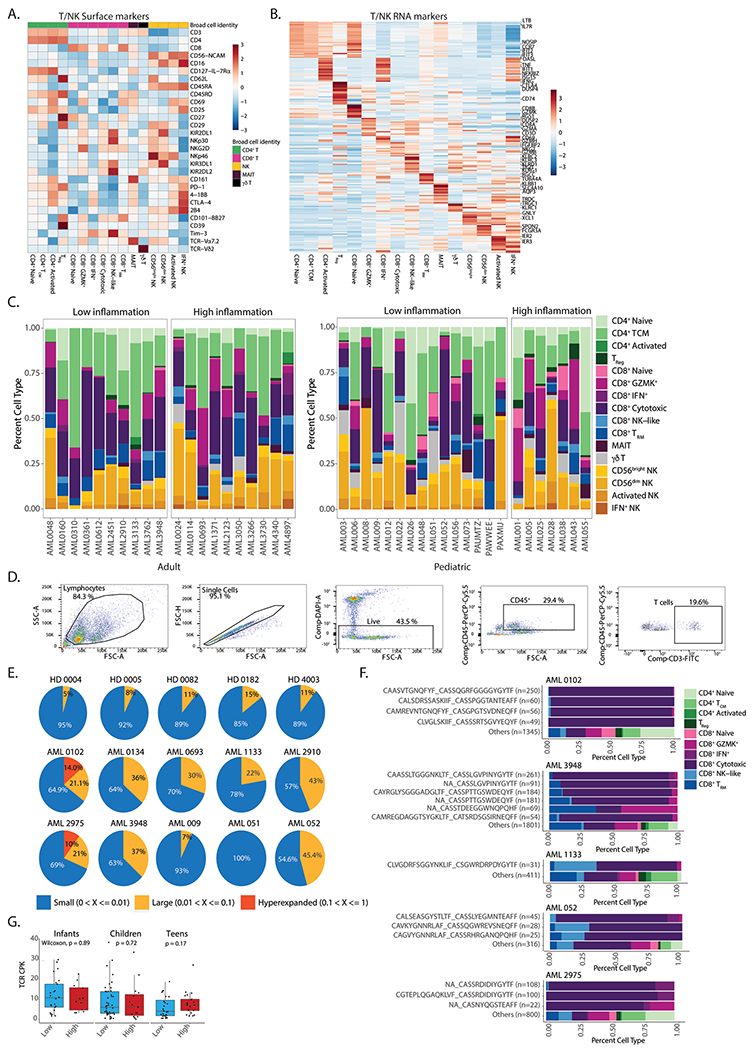
Extended Data Fig. 8 |. T cell responses in AML.

a. Heatmap of average expression of surface protein markers in different T cell subsets. TCM – central memory T cells; TReg – regulatory T cells; TRM – resident memory T cells. b. Heatmap of average expression of RNA markers in different T cell subsets. c. Quantification of T cell subsets in high and low inflammation AML patients. d. Gating strategy for sorting of T cells from AML or healthy donor BM aspirates. e. Pie charts representing the fraction of small (0-1%), large (1-10%) and hyperexpanded (10–100%) clones in individual samples. f. Quantification of CD8+ subsets from expanded clones in AML patients. g. Clonal diversity in infants (0-3 years old, n = 37), children (3-12 years old, n = 59) and teens (12-21 years old, n = 49) from the TARGET-AML bulk RNA-Seq cohort. All statistical tests shown in this figure are two-sided. All box plots represent the median with the box bounding the interquartile range (IQR) and whiskers showing the most extreme points within 1.5× IQR. All pair-wise comparisons were evaluated using Wilcoxon test.
