
Fig. 3 |. Atypical B cells are associated with high inflammation in AML.
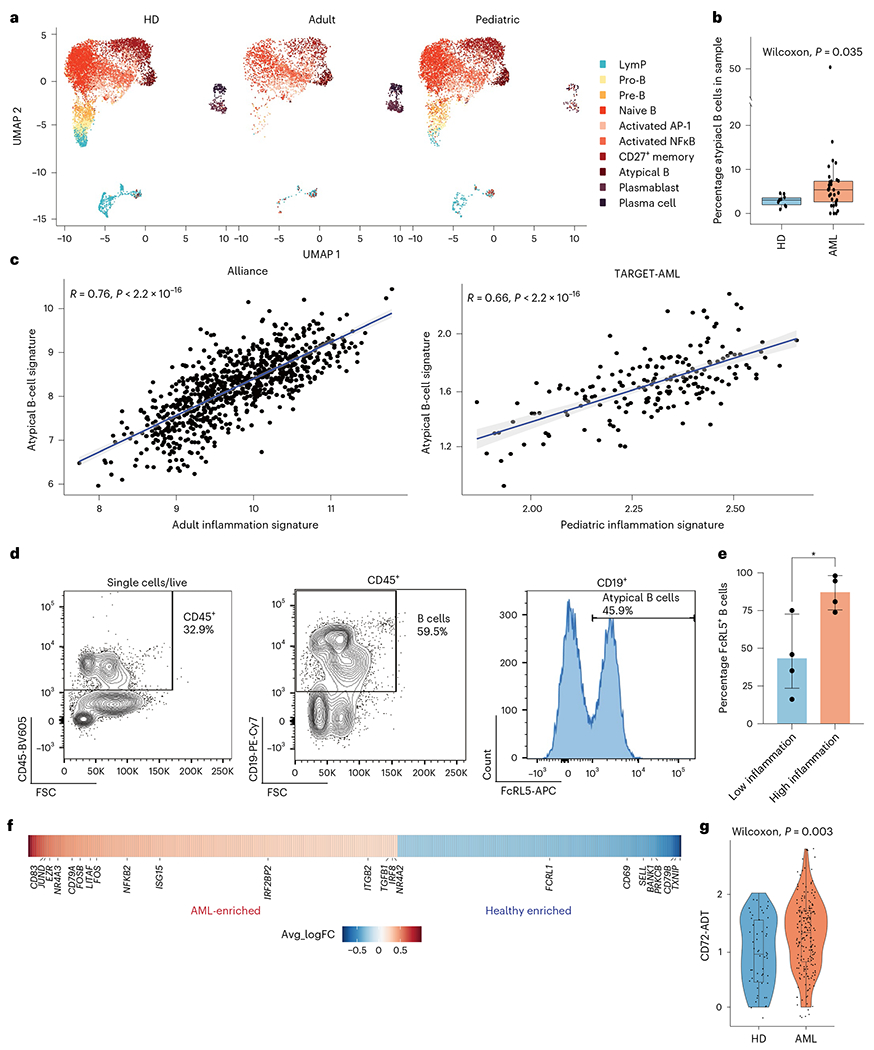
a, Split UMAP projection of B cells from healthy donors (HDs) (n = 10), adult (n = 20) and pediatric (n = 22) AML BM, annotated based on transcriptome and surface protein expression. b, Quantification of atypical B cells in healthy donors (n = 10) and AML (n = 30) BM. Wilcoxon test was used to evaluate statistical significance. Box plots represent the median with the box bounding the interquartile range (IQR) and whiskers showing the most extreme points within 1.5 × IQR. c, Correlation between the atypical B-cell signature and the inflammation signature in the Alliance cohort (adult patients, n = 872) and the TARGET-AML cohort (pediatric patients, n = 157). d, Representative FACS plot showing gating strategy for atypical B cells in BM aspirates. e, Quantification of FACS analysis of atypical B cells in BM aspirates from low-inflammation (blue, n = 4) and high-inflammation (red, n = 4) patients with AML. Error bars represent s.d. A t-test was used to evaluate statistical significance. f, Heat map of genes upregulated (red) or downregulated in atypical B cells from patients with AML compared to control. g, CD72 surface protein expression on atypical B cells from control (blue, n = 2) and patients with AML (red, n = 10). Wilcoxon test was used to evaluate statistical significance. Box plots represent the median with the box bounding the IQR and whiskers showing the most extreme points within 1.5 × IQR. All statistical tests shown in this figure are two-sided.