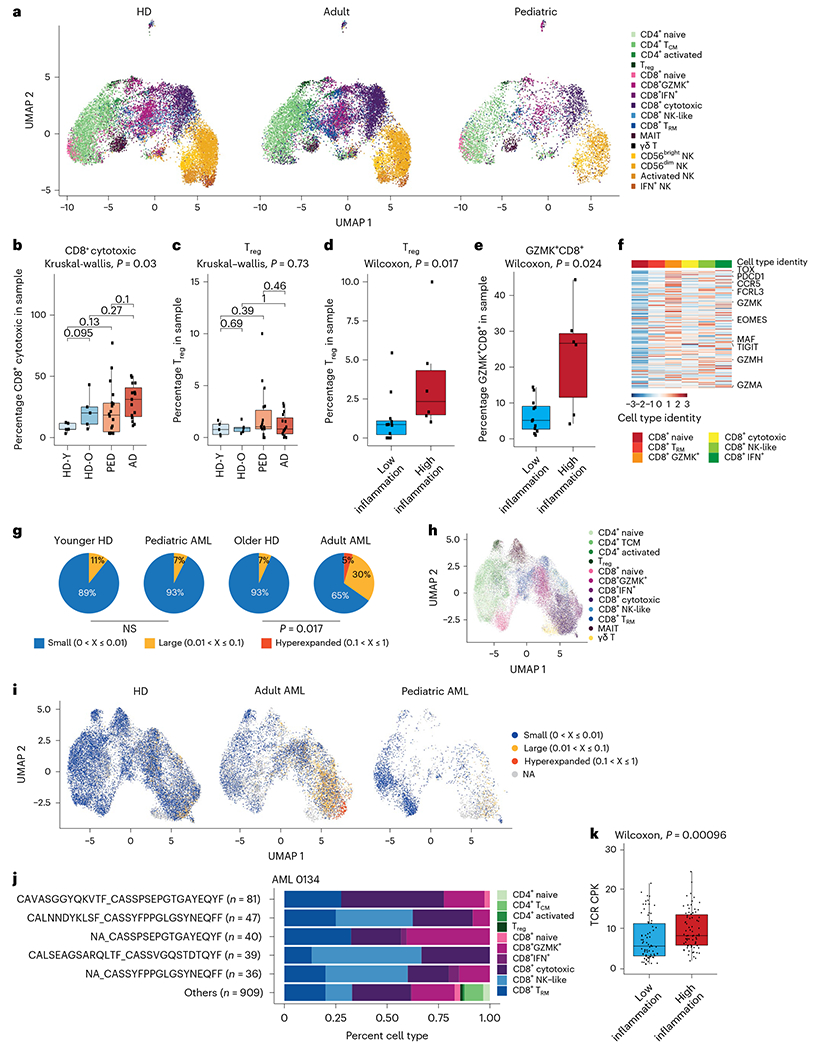
Fig. 4 |. T-cell responses in human AML.

a, Split UMAP projection of T and NK cells from healthy donors (n = 10) and adult (n = 20) and pediatric (n = 22) patients with AML. b, Quantification of cytotoxic CD8+ T cells in healthy donors and pediatric and adult patients with AML. HD_Y, healthy donors 19–26 years old (n = 5); HD_O, healthy donors 39–55 years old (n = 5); PED, pediatric AML (n = 22); AD, adult AML (n = 20). Box plots represent the median with the box bounding the IQR and whiskers showing the most extreme points within 1.5 × IQR. A Kruskal–Wallis test was used to evaluate statistical significance in multigroup comparison, whereas a Wilcoxon test was used for two-group comparisons. c, Quantification of Treg cells in healthy donors, and pediatric and adult patients with AML. Box plots represent the median with the box bounding the IQR and whiskers showing the most extreme points within 1.5 × IQR. A Kruskal–Wallis test was used to evaluate statistical significance in multigroup comparison, whereas a Wilcoxon test was used for two-group comparisons. d, Quantification of Treg cells in low- (n = 12) or high-inflammation (n = 6) pediatric patients with AML. Box plots represent the median with the box bounding the IQR and whiskers showing the most extreme points within 1.5 × IQR. A Wilcoxon test was used to evaluate statistical significance. e, Quantification of GZMK+ CD8+ T cells in low- (n = 12) or high-inflammation (n = 6) pediatric patients with AML. Box plots represent the median with the box bounding the IQR and whiskers showing the most extreme points within 1.5 × IQR. A Wilcoxon test was used to evaluate statistical significance. f, Heat map of expression of the Tpex cell gene signature in CD8+ T cells in the BM. g, Pie charts representing the fraction of small (0–1%), large (1–10%) or hyperexpanded (10–100%) T-cell clones in controls and patients with AML (adult, n = 7; pediatric, n = 3). Younger HD, healthy donors 19–22 years old (n = 3); older HD, healthy donors 43–55 years old (n = 2). NS, not significant. h, UMAP projection of T cells from healthy donors (n = 5) and adult (n = 7) and pediatric (n = 3) patients with AML, annotated based on transcriptome. i, UMAP projection of T-cell clones from healthy donors (n = 5) and adult (n = 7) and pediatric (n = 3) patients with AML. NA, not available. j, Quantification of CD8+ subsets from expanded clones for sample AML 0134. A full list of expanded clonotypes is in Supplementary Table 10. k, Clonal diversity in low-inflammation (n = 75) and high-inflammation (n = 76) patients with AML from the TCGA cohort. Box plots represent the median with the box bounding the IQR and whiskers showing the most extreme points within 1.5 × IQR. A Wilcoxon test was used to evaluate statistical significance. All statistical tests shown in this figure were two-sided.
